Earth, Wind & Fire albums and songs sales
Few bands have ever mixed genres with as much swagger and soul as Earth, Wind & Fire. When Maurice White put the group together in 1969, he wasn’t aiming small. He pulled in the heat of funk, the smoothness of soul, the groove of R&B, the shimmer of disco, the freedom of jazz, and even a splash of pop. What emerged was a sound so original, it refused to stay in just one lane.
And they didn’t just make records—they made events. Dazzling costumes, cosmic stage shows, and a spirit that screamed celebration and uplift. They weren’t just playing music—they were sending out a vibe the world hadn’t seen before.
They moved units, undoubtedly with tens of millions of records worldwide, both with albums and singles. They stacked Grammys, but more importantly, they redefined what Black music could sound and look like. They opened doors, raised bars, and lit fires under generations of artists who followed. So let’s rewind the tape and trace how Earth, Wind & Fire turned hustle into history and grooves into legacy.
Looking at the big picture: Earth, Wind & Fire
Early Years & Formation (1969-1971)
Back in 1969, Maurice White, a sharp session drummer fresh out of Chess Records and a key player in the Ramsey Lewis Trio, had a vision. He didn’t just want a band; he wanted a movement, something that fused R&B, jazz, funk, and pop into something brand new. His first shot, The Salty Peppers, didn’t make much noise, so he packed up for L.A., found a new crew (including his younger brother Verdine White), and gave the band a new name: Earth, Wind & Fire, pulled from his astrological chart.
They landed a deal with Warner Bros. and dropped two records in 1971, Earth, Wind & Fire and The Need of Love. Neither lit up the charts. But then came a lineup shakeup. That’s when Philip Bailey, Larry Dunn, and Ralph Johnson came on board. And just like that, the group’s signature sound started to take shape.
Breakthrough & Rise to Fame (1972-1975)
Things changed when they moved over to Columbia Records in 1972. Last Days and Time showed promise, but Head to the Sky in 1973 really started turning heads. Tracks like Evil and Keep Your Head to the Sky helped the album go gold.
By 1975, they were entirely in the zone. That’s the Way of the World was the spark, and Shining Star was the fire. That track hit No. 1 on the Billboard Hot 100, and the album blew up. Their mix of tight harmonies, smooth grooves, and uplifting lyrics made them unstoppable.
Peak of Success & Cultural Impact (1976-1981)
From the mid-1970s on, they didn’t just play music; they turned it into a spectacle. Elaborate stages, fire effects, Egyptian-inspired visuals—Earth, Wind & Fire brought theater to funk. Albums like Spirit (1976) and All ‘n All (1977) dropped back-to-back classics like Fantasy and Serpentine Fire.
As disco fever swept throughout the late 1970s, they rolled with it, without ever selling out. I Am (1979) gave us Boogie Wonderland and After the Love Has Gone, both massive hits. And then there’s September, released way back in 1978, but still being streamed like wildfire and filling up dance floors.
Decline & Reinvention (1982-1993)
The 1980s brought a shift. The emergence of new wave, synth-pop, and shifting tastes made it harder for them to hold their spot. Raise! (1981) held firm, but both 1983 follow-ups Powerlight and Electric Universe didn’t land quite the same.
By 1984, Maurice White had stepped back from touring due to health issues, and the group took a pause. However, in 1987, they made a comeback with Touch the World, featuring the System of Survival. They kept recording through the early 1990s, though the massive hits of the past were fewer and farther between.
Legacy & Continued Influence (1994-present)
Even as their spotlight dimmed, their legacy continued to grow. In 2000, they earned their spot in the Rock & Roll Hall of Fame. Maurice White stayed out of the public eye as he battled Parkinson’s, which claimed his life in 2016, but his vision never faded.
Today, Philip Bailey and Verdine White still carry the torch on stage. Their music continues to find new ears, sampled in hip-hop, featured in movies, celebrated every September 21st, and passed down through generations.
ChartMasters’ method: the CSPC
As usual, I’ll be using the Commensurate Sales to Popularity Concept (CSPC) in order to relevantly gauge the act’s results. It will not only bring you sales information for all albums, physical and download singles, as well as audio and video streaming. In fact, it will really determine the act’s popularity.
If you are not yet familiar with the CSPC method, below is a nice and short video of explaining the concept. I recommend watching it before reading on and to the sales figures. You’ll get the idea in just two minutes.
And if you want to know the full method as well as formulas, you can read the full introduction article.
Now let’s get into the artist’s detailed sales figures!
Earth, Wind & Fire album sales
Updated studio album sales & comments
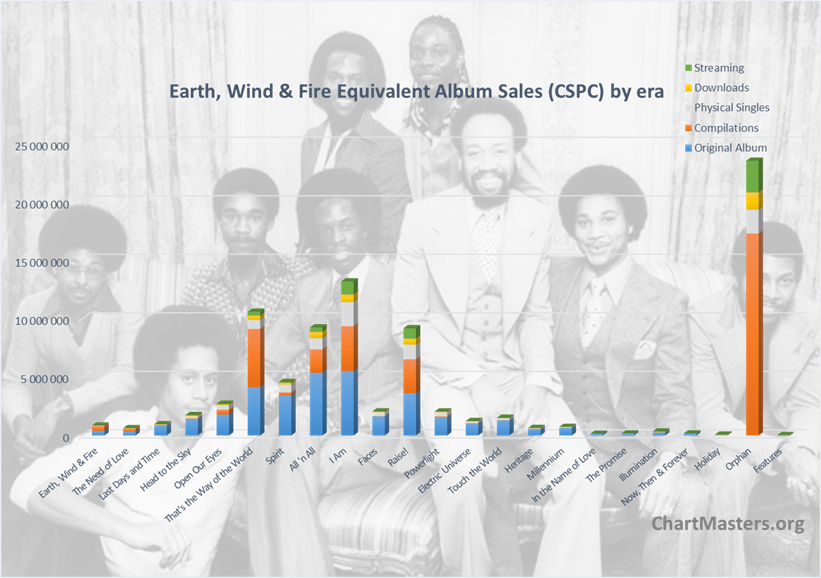
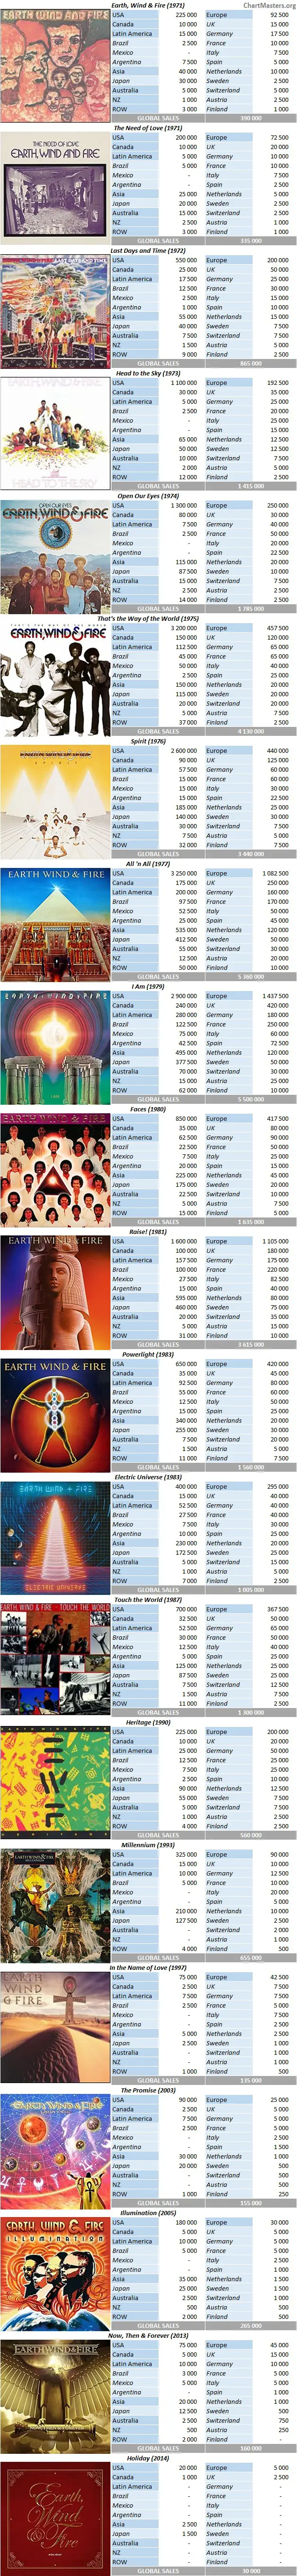
Earth, Wind & Fire‘s pure album sales chart a steady rise from modest beginnings to major commercial visibility, followed by a long tapering off. Their first two records—Earth, Wind & Fire and The Need of Love—sold below 400,000 each, which was pretty typical for new acts in the early 1970s without hit singles or strong radio backing. However, things picked up with Last Days and Time (865,000), then broke through with Head to the Sky (1.4M) and Open Our Eyes (1.8M), signaling that the group was building a real audience.
From 1975 to 1981, they hit their stride. That’s the Way of the World (4.1M), Spirit (3.4M), All ’n All (5.4M), I Am (5.5M), and Raise! (3.6M) made up the heart of their commercial peak. These albums didn’t just sell well for a funk or R&B act—they performed on par with some of the bigger Black music albums of the time from the likes of Stevie Wonder and the Commodores. For the 1970s, hitting 4–5 million in pure album sales was a strong indicator of mainstream reach, especially for a band rooted in Black music traditions.
After Raise!, sales declined. Powerlight and Electric Universe still sold over a million each, but it was clear the group was losing traction. Part of that came down to timing—the early 1980s saw a shift toward synth-heavy pop and video-driven acts, and EWF’s dense arrangements weren’t a natural fit for that environment. When they returned in 1987 with Touch the World, they still managed 1.3 million units, which was respectable for a legacy act re-entering the market.
From the 1990s onward, the numbers got smaller. Millennium sold 655,000 copies, but later records, such as Illumination and Now, Then & Forever, only sold in the low hundreds of thousands. That’s not unusual—most veteran acts in the CD and digital download era saw similar drops, especially without radio support or viral visibility. These records mostly catered to longtime fans rather than trying to chase charts.
In total, their studio albums moved over 34 million copies. The bulk of that came from a 6–to 7–year window when they were at their commercial peak. That arc—slow start, strong peak, long tail—is common for bands that cross into mainstream success without leaning entirely on singles. It also shows they maintained enough demand to stay in the conversation even as the industry moved on.
Want to compare the act’s albums with others?
Earth, Wind & Fire songs sales
Below, we list down results from the artist through physical sales, digital sales, and streaming.
Please be aware that when the artist is regarded as the lead act, they are rewarded with 100% of these units. However, featured acts share a 50% piece of the total.
Physical singles
Earth, Wind & Fire didn’t just hit big album sales, they moved serious numbers in singles too, especially by the standards of the physical era, when even a million-selling 45 was a notable feat.
Their biggest hit on this front, “Boogie Wonderland,” sold 4.03 million copies worldwide. When the single was released in 1979, some radio programmers were unsure if it would catch on as disco was starting to wear thin with critics. But listeners didn’t hesitate. The collaboration with The Emotions and the song’s dancefloor energy made it fly. With 4 million sold, it wasn’t just their biggest single; it was one of the top-selling singles of that era, period.
Right behind it were Let’s Groove with 3.80 million and September with 3.54 million, both staples that demonstrated real commercial appeal in markets from the U.S. to Japan.
Several other singles surpassed the million mark, further strengthening their chart presence. After the Love Has Gone cleared 2.02 million, Fantasy hit 1.87 million, and both Shining Star, Got To Get You Into My Life, Sing A Song, Getaway, Serpentine Fire, and Fall In Love With Me also broke into seven-digit territory. That’s The Way of The World and Saturday Nite came very close too. The group consistently landed physical hits in a space where most of their genre peers enjoyed at most a couple of smashes.
That said, a few songs that are now central to their reputation didn’t sell much as singles. Reasons is a prime example. It’s everywhere today, widely sampled and with solid streams, but back in the day, it only sold 35,000 copies in physical form due to a limited release. Same goes for Can’t Hide Love (355,000), a slow burn that didn’t catch fire in retail even though it’s widely considered one of their strong tracks now. Those numbers don’t reflect a lack of impact, just how the singles market worked back then. Not every key song was pushed as a radio-ready 45.
One that stands out in the opposite direction is Got to Get You Into My Life. At 1.27 million, the cover of the Beatles‘ song performed better than several of their original tracks. The song got a boost from being featured in the Sgt. Pepper’s Lonely Hearts Club Band movie soundtrack, which gave it crossover attention beyond their core R&B audience. It’s a good reminder that timing and packaging could shape how a track performed at the register.
All in all, the band sold 32 million physical singles, an imposing total.
Digital songs
Earth, Wind & Fire‘s digital single sales reveal which songs have maintained their grip on listeners decades after their release. September is a runaway success, with over 8 million downloads and ringtones worldwide —a rare achievement for any catalog track. The song received a fresh boost from its placement in the 2006 film Night at the Museum, and in 2011, thanks to Intouchables, which introduced it to a younger audience. That’s just part of the story still. It’s now practically baked into pop culture, parties, commercials, and social media. More than any other track in their catalog, it’s crossed into evergreen territory.
Let’s Groove (3.2M) and Boogie Wonderland (2.3M) follow with substantial numbers. Both are upbeat, instantly recognizable, and easy to slot into dance and workout playlists. Fantasy, initially not a massive single (#32 in the US), shows clear upward movement at 1.74 million. Its soaring arrangement and emotional weight give it legs well beyond its original release window, particularly in streaming-heavy environments. It is especially popular across Asia.
Not every hit kept the same momentum. After the Love Has Gone holds up well with 1.08M, but former US chart topper Shining Star (685K) and top 10 hit Got to Get You into My Life (275K) aren’t quite as visible in the digital space, despite their past status. Meanwhile, Love’s Holiday (725K) and In the Stone (535K) came out ahead of expectations. The latter in particular found new life through marching band arrangements and sports intros—places where a song’s energy can carry it far, even without major chart history.
Great sellers with both studio albums and physical singles, Earth, Wind & Fire‘s digital sales are perhaps even more impressive at 27 million.
Streaming
Streaming is made up of both audio and video streams. Our CSPC methodology includes both formats to better reflect the real popularity of each track.
The main source of data for each avenue is Spotify and YouTube, respectively. To factor in the growing impact of multiple Asian countries where these platforms aren’t always the go-to site for music streaming, more sources have been added.
In order to account for their real popularity in each relevant country, the below sources have been used along with the mentioned ratios that reflect the market share of each area.
Audio Streams
– South Korea: Genie streams * 2.20 (consistent with Gaon streaming numbers)
– Japan: AWA streams * 100 / 4 (AWA has 4% of the Japanese streaming market)
– Arabic world: Anghami streams
– Sub-Saharan Africa: Boomplay + Audiomack streams
– Elsewhere: Spotify streams * Spotify market shares based on artists’ market distribution
Video Streams
– China*: QQ video streams * 50 if the song is available for audio stream, QQ video streams * 5 elseway (scale built based on known figures for several major artists)
– Elsewhere: Youtube views increased by 10% to account for various local platforms
*since Chinese streaming platforms are mostly video streaming platforms, their streams are weighted on par with YouTube streams.
Audio Stream value – 1,500 plays equal 1 album unit
Video Stream value – 6,750 views equal 1 album unit
Equivalent Albums Sales (EAS) = ( Spotify * ArtistRatio + Genie * 2.20 + AWA * 100 / 4 + Anghami + Boomplay + Audiomack ) / 1500 + ( QQ views* 50(or 5) + YouTube * 1.1 ) / 6750
Top hits
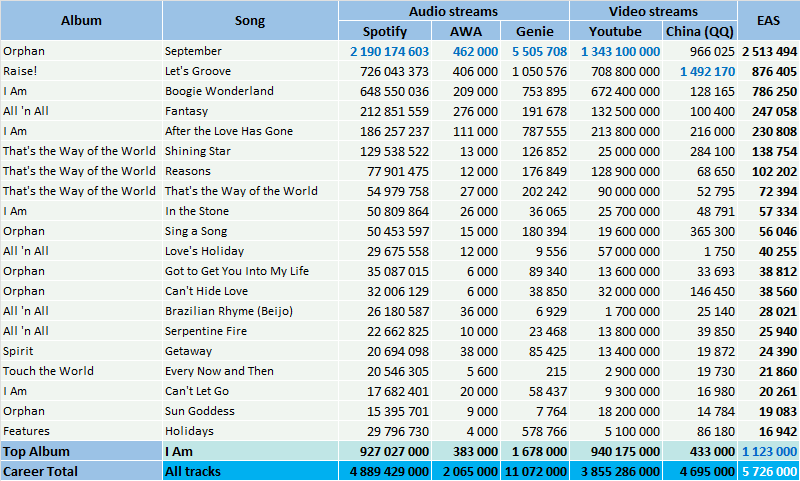
Earth, Wind & Fire‘s streaming numbers make it pretty clear which songs still hit hardest—and September is way out in front. With over 2.19 billion streams on Spotify and more than 1.3 billion views on YouTube, it’s easily their most-played track across platforms. It’s also doing strong business in Asia, pulling in 5.5 million streams on South Korea’s Genie and close to a million EAS from China’s QQ Music. Add it all up and you’re looking at more than 2.5 million album-equivalent sales. Due to its lyrics, the song explodes on streaming platforms every year on September 21.
Let’s Groove and Boogie Wonderland trail behind but still post big numbers—726 million and 648 million streams on Spotify, plus huge view counts on YouTube. Let’s Groove actually outperforms September in China, with over 1.49 million EAS from QQ Music alone. Its slick, synth-heavy groove seems to hit exceptionally well in places where electronic pop has stayed in style. They’re the kind of songs that never really disappear—they pop up in party playlists, gym mixes, and anywhere algorithms lean into feel-good energy.
Fantasy and After the Love Has Gone aren’t pulling in blockbuster numbers, but they’re still getting played—hundreds of millions of streams and enough presence to show they haven’t faded out. Shining Star, on the other hand, seems to have lost some ground. With 130 million Spotify plays and lower visibility on video platforms, it’s not experiencing the same kind of digital carryover, despite being a big hit back in the day. Not every chart-topper hangs on in the streaming era—some just fade if they’re not being surfaced in new ways.
Some of the lesser-known tracks are holding their own in more specific corners of the world. Brazilian Rhyme (Beijo), for example, performs surprisingly well on Japan’s AWA, even if its global numbers are modest.
What the numbers really show is how the right songs stick around—whether it’s on a dance floor, a long drive, or a random playlist that lands on a familiar groove. Across all platforms, the band has pulled in nearly 4.9 billion Spotify streams, 3.8 billion YouTube views, and more than 5.7 million EAS.
Full catalog breakdown
If you are famil,iar with the artist’s catalog and want to check details of each and every song, you can access to all of them right here.
Keep yourself up to date
Our website provides you a fantastic tool which fetches updated Spotify streams as you request them, use it to watch these results grow day after day!
Earth, Wind & Fire compilation sales
It sounds fairly logical to add together weighted sales of one era – studio album, physical singles, downloads, streams – to get the full picture of an album’s popularity.
However, older releases generate sales over various live, music videos and compilation albums. And all those packaging-only records do not create value. They exploit the value originating from the parent studio album with each of its tracks instead. Inevitably, when such compilations are issued, they downgrade catalog sales of the original LP.
Thus, to accurately gauge the worth of these releases, we need to re-assign sales proportionally to its contribution of all the compilations which feature its songs. Here is how we do that.
Assigning compilation sales to original studio albums
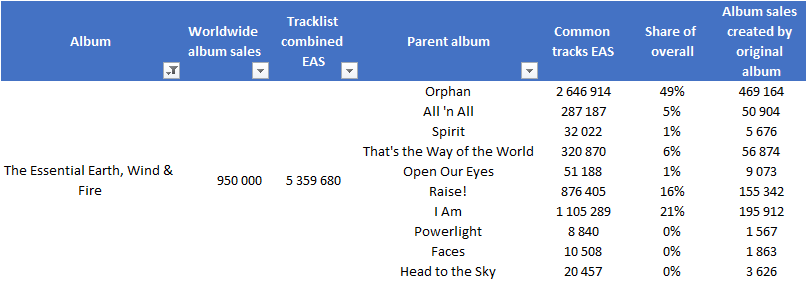
How do you understand this table? For example, if we check The Essential Earth, Wind & Fire line, these figures mean it sold 950,000 units worldwide. The second statistics column means all versions of all the songs included in this package add up to 5,359,680 equivalent album sales from streams across all formats.
The second part (on the right of the table) shows how many equivalent streams are coming from each original album, plus the share it represents in the overall package.
Therefore, the streaming figures convey that songs from I Am equate to 21% of The Essential Earth, Wind & Fire‘s tracklist attractiveness. Meaning, it generated 196,000 of its 950,000 album sales and so on for the other records.
Raw compilation sales
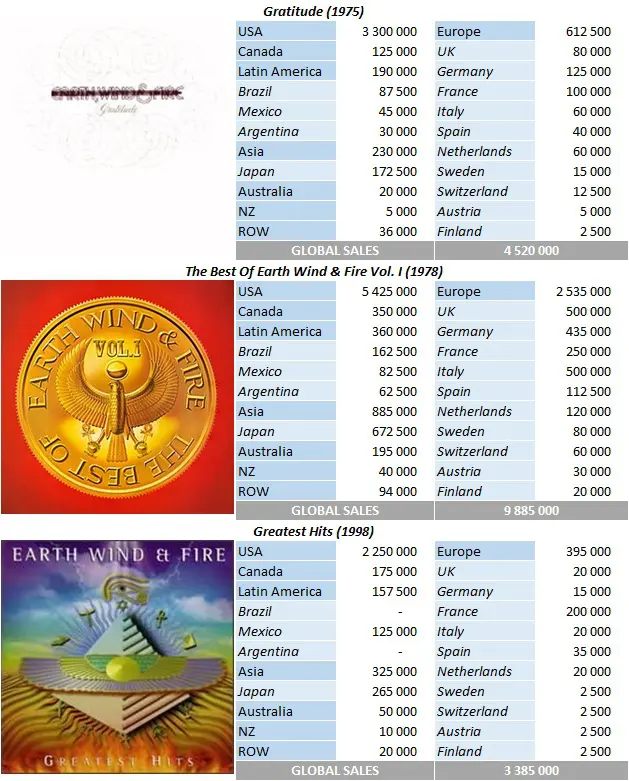
Earth, Wind & Fire‘s compilation album catalog encompasses a diverse range of products, spanning from their early days to the 2020s. The most successful by a wide margin is The Best of Earth, Wind & Fire, Vol. I, released in 1978, has sold 9.88 million copies. For years, the first home of the September track was the go-to entry point for casual listeners, especially during the CD boom of the late 1980s and 1990s, thanks to its concise tracklist and broad distribution.
The second biggest is Greatest Hits (1998), which sold 3.39 million. It arrived during the peak of catalog CD sales, offering remastered sound and a more modern presentation for retail markets. Alongside it, Gratitude (1975)—technically a live album with hits—also functions as a de facto compilation; the #1 album in the US rounds out the podium thanks to its 4.52 million copies sold.
Other notable performers include Super Hits (1998) with 1.09 million sold, and The Best of Earth, Wind & Fire, Vol. II (1988), which sold 1.4 million. Titles like The Essential Earth, Wind & Fire (2002, 950,000) and The Very Best Of (1991, 540,000) push totals to higher ground.
Many other compilations fall into the mid-tier range—Dance Tracks, Big Hits & Remixes, and Let’s Groove – The Best Of all sold in the 250,000–325,000 range. These were often regionally marketed or aimed at more niche segments (club mixes, ballads, or country-specific issues). While not global blockbusters, they reflect the steady demand for tailored EWF packages. Several video compilations, such as Live [Video] (1995, 310,000) and In Concert [1983] (285,000), also performed well in the home video market, which peaked in the VHS-to-DVD transition period.
Altogether, these releases have sold 32 million copies, another healthy score.
Re-assigned compilation sales – Results & comments
Here is the most underestimated indicator of an album’s success: the amount of compilation sales across all versions that were generated. Due to the dependency of sales of the original studio albums on these releases, they are a key piece of the jigsaw.
To clarify that, we take the Raw compilation sales results and assign the numbers to the related original studio albums, as described in the first section Assigning compilation sales to original studio albums.
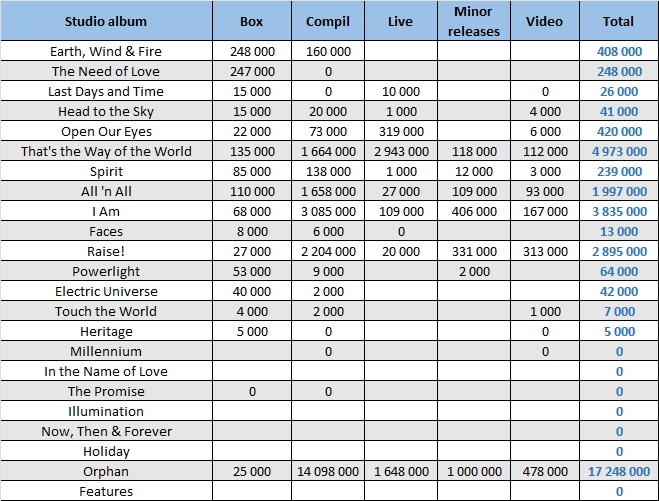
With September coming out outside of their studio albums (first available on The Best of Earth, Wind & Fire, Vol. 1), the Orphan folder powers to 17 million sales of compilations. It wasn’t their only hit, though, which is visible with That’s the Way of the World, All ‘n All, I Am, and Raise!, also generating millions of sales of recycled material.
Bonus: Top-selling compilations’ breakdowns
Bonus: Total album (all types) sales per country
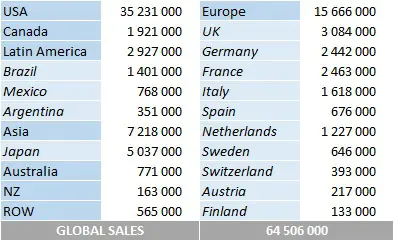
Please note country-specific numbers may miss sales of a few minor releases, although totals are complete.
Earth, Wind & Fire: career results (CSPC)
So, after checking all the figures, how many overall equivalent album sales has each album achieved? Well, at this point we hardly need to add up all of the figures defined in this article!
Albums results (CSPC)
In the following results table, all categories display figures in equivalent album sales. If different, pure sales are listed between parentheses.


As a reminder:
- Studio Album: sales of the original album
- Other Releases: sales of compilations generated thanks to the album
- Physical Singles: sales of physical singles from the album (ratio 3/10)
- Download Singles: sales of digital singles from the album (ratio 1,5/10)
- Streaming: equivalent album sales of all the album tracks (ratio 1/1500 for Audio stream and 1/6750 for Video stream)
Artist career totals
See where the artist ranks among remaining singers
I Am (13.2 million), That’s the Way of the World (10.6 million), All ‘N All (9.2 million), and Raise! (9.2 million) confirm their place among the all-time R&B greats. Few black artists reached these numbers during the 1970s, let alone doing it four times.
Hits? Absolutely. But their consistency has also been impressive. From 1973’s Head to the Sky to 1987’s Touch the World, they delivered 11 straight million-selling albums.
And then, we have yet to speak about the elephant in the room. The Orphan section accounts for 23.5 million sales thanks to the monumental success of September.
Their legacy totals a stunning 86 million equivalent album sales.
Singles results (CSPC)
The list is compiled in album equivalent sales generated by each song. Therefore, these figures are not merged units of singles formats. Instead, the list includes weighted sales of the song’s physical single, download, ringtone and streaming as well as its share among sales of all albums on which it is featured.
Want to compare the act’s songs with other top hits?
Discography results (ASR)
Thanks to our new ASR (Artist Success Rating) concept, we know that sales represent 34.88 million times the purchase of entire discography. Coupled with total sales, it translates into an ASR score of 223. The ranking of all artists studied so far is available too at this link.Records & achievements
- At 2,044,889,996 streams, September is the 5th most-streamed 1970s song on Spotify.
- At 19,781,000 EAS, September is among the 20 best-selling 1970s songs.
- At 13,177,000 EAS, I Am is the 9th best-selling album from 1979.
- At 9,171,000 EAS, Raise! is the 9th best-selling album from 1981.
Dynamic Spotify key performance indicators
Earth, Wind & Fire
Current followers count: 4,974,953 4,000,000 followers have been reached on 08/21/23 3,000,000 followers have been reached on 07/30/21 >> Daily breakdown
Earth, Wind & Fire is #815 among the most followed artists of all-time >> Visit our Top 5,000 most followed artists ranking
Current streams count: 4,884,941,503 4,000,000,000 streams have been reached on 06/02/25 1,000,000,000 streams have been reached on 05/12/25 4,000,000,000 streams have been reached on 09/01/24 3,000,000,000 streams have been reached on 03/09/23 2,000,000,000 streams have been reached on 07/29/21 >> Daily breakdown
Earth, Wind & Fire is #528 among the most streamed artists of all-time Popularity Rating: /100 >> Visit our Top 1,000 most streamed artists ranking >> Visit our Top 20 highest rated artists ranking
Current monthly listeners: 22,633,642 (Trend: 0) Global chart position: #317 The artist top 50 cities come from 20 distinct countries >> Global impact breakdown
As usual, feel free to comment and / or ask a question!
Sources: IFPI, Spotify, YouTube, Discogs, Billboard.
You may be interested in…
… Earth, Wind & Fire‘s streaming masters analysis
… checking out the upcoming artists or even voting for them!
… similar artists
… best-selling artists, albums, and singles
Artists
360° analytics – Best-Selling Artists | by Decade
Tools: Artist Dashboard | Artists Comparator
Streaming deep dive – Most-Streamed Artists
Tools: Playcounts | Royalties | Global Reach | Stats History
Other KPIs – Monthly listeners | Followers | Top money makers