More features, less problems

If you are one of our regular readers, you know that we at ChartMasters aim at constantly improving the way we work.
Over the last months, we have been listening to recurrent requests and frustrations among our readers as well as identifying difficulties we had producing CSPC estimates and retrieving streaming numbers.
Then, we have worked hard on solutions for the toughest pain points. And today, we can proudly announce major improvements that will please you as much as they please us.
Here are the four targets we have set for ourselves and will continue working on over the coming months:
- Completing our all-time lists and keeping them up-to-date
- Shedding light on streaming platforms other than Spotify
- Upgrading the streaming tool‘s reliability
- Making detailed data searchable and sortable
Some of the changes needed to achieve these goals are already in place. Some will need more work and adjustments on our side.
Let’s get into the details!

Target#1: Completing our all-time lists and keeping them up-to-date
It sounds like a big thing? Well, it is, but we have reasons to believe we can make it!
The pain point
No matter how accurate our all-time top selling artists ranking is, data obsolescence and the incompleteness of the list is hurting our own original mindset – Music industry – One step closer to being accurate.
In fact, it was the whole point of ChartMasters’ creation: fighting against the way too many inflated numbers which were flooding websites and social media. That’s how the CSPC method has been introduced early 2016.
Even before that, I have been posting streams-to-sales conversions online since 2013. And I have started estimating artists’ sales figures in 2003. All in all over these 20 years, I’ve done several rounds of estimates, aiming at defining the top-selling artists, at first considering pure album sales only.
The conclusion has always been the same. Studying each artist was so time-consuming that the first studies were outdated before I could get to the last name among relevant artists.
The problem is: as accurate as a figure may be, when it gets outdated, it loses potency. And fans and lazy media professionals then quickly revert to the good ol’ inflated claims.
The Beach Boys, perhaps the most legendary act which has yet to be studied by our team.
Another element which can logically decrease the credit given to our work to build all-time lists is the absence of some artists. While the recent addition of Frank Sinatra completes the top tier, some very strong artists like Neil Diamond or the Beach Boys are still missing.
As you understand, the length of the estimate process was undermining our ability to fulfill our very purpose.
But for the first time in 20 years, I can now say that we are in a spot where having a comprehensive list of the top selling artists with accurate figures is possible. Our goal is that over the upcoming months our all-time best selling artists list will include all major omissions and receive updated data for virtually all artists.
To do that, we’ve been setting up various tools and methods in the background lately. I’m not exaggerating if I say that some of the new layers that we are now adding are a real revolution by themselves.
I’ll start by listing these key changes and then, I’ll detail how and when these changes will be applied.
Revolution #1: introducing Beta CSPCs
A couple of years ago, we started to publish Light CSPCs. They are also career-reviews with numbers from all formats, but with a simplified layout. We use this format for very recent artists who still have small discographies and no compilations. For artists who are still missing from our leaderboards, we are now going to publish Beta CSPCs.
Beta CSPCs won’t change much in the final layout, but the methods used will be simplified.
Thanks to our experience and information, it’s often almost immediate to know that an album sold about 100,000 pure units in the UK. To know if it moved 95,000 or 105,000 units instead can require heavy verifications yet, going through many weekly charts one by one. It raises an interesting question. Is it better to estimate one artist very precisely or five with a slightly larger error margin?
Here, we are switching our paradigm.
So far, we went by the former option, mainly because we had little hopes in completing all artists anyway. As mentioned, this is changing. Our background of tools is now strong enough to aim at having our all-time lists completed… with fresh enough data.

Revolution #2: updating pure sales constantly
When I published the first CSPC articles, I personally and manually collected all the data, including the streaming statistics. In 2020 (for artists) and 2021 (for albums) we made huge steps forward. We integrated our streaming tools with CSPC articles, enabling streaming data to be updated automatically every day.
From now on, we will also get automatically updated pure sales figures thanks to new algorithms.
How do we do that?
Introducing sales trends
The majority of sales nowadays are either new albums which sell most of their units in a few weeks only, or classic albums enjoying steady recurrent sales.
To deal with the latter, CSPC estimates will now also include figures for recurrent yearly sales in the background. For convenience purpose, we will call them sales trends. The data printed on screen will be the last known figure plus the recurrent sales over the number of days passed since that last known figure, rather than our estimate which is frozen in time.
We’ve actually tested and applied this method to the entry of Frank Sinatra. His 2015 compilation Ultimate Sinatra, displayed inside the “Compilations sales figures listing” table, sold 1.1 million units up to the publication. But this compilation is routinely selling 2,000 units per week for several years. So this trend was set up, and as I’m writing these lines the figure you’ll see for it is now 1.11 million. The tally will continue to increase as weeks pass.
Adding stand-alone estimates thanks to database-homed figures
Of course, a new compilation can be released and move away general public pure sales away from Ultimate Sinatra. All figures have been uploaded to our database, with administration screens set up to force a new sales value and / or a new sales trend for recurrent at any time in the future.
This is then automatically impacted everywhere, from the pure sales of the compilation, the share of them assigned to studio albums, the latter’s CSPC total and the artist overall tally.
For the sake of the example, I’ve pointed out the strongest selling catalog item by Frank Sinatra. It is a compilation, but the process has been set for all sales figures. Studio albums, compilations, downloads, and physical singles, all of them will be automatically updated over time.
Obviously, the possibility to easily force a value at any time will make it very easy to define sales for a new album by a contemporary artist. Added to recurrent sales process for the rest of the catalog, the entire CSPC entry for the artist will remain up to date.
Scanning charts to detect outliers
Parallel to that, we are building charts to sales conversion tools for the US (covering nearly 80 years) and the UK. As they are still in beta mode, these pages are not available to the public for now. But you’ll quickly understand how we are going to use them.
Below are screen shots of these backend features, for both the US and the UK.
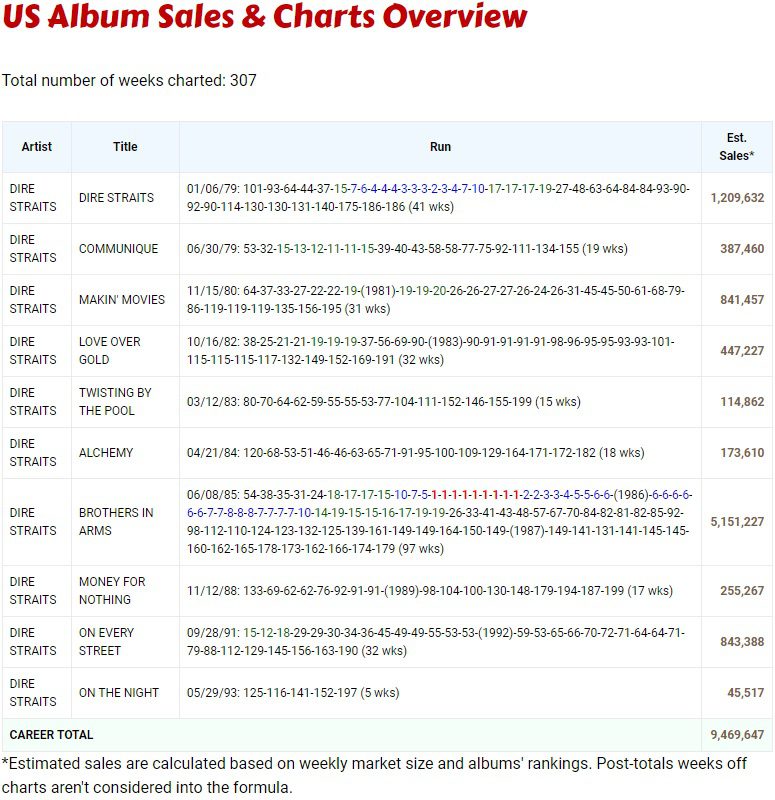
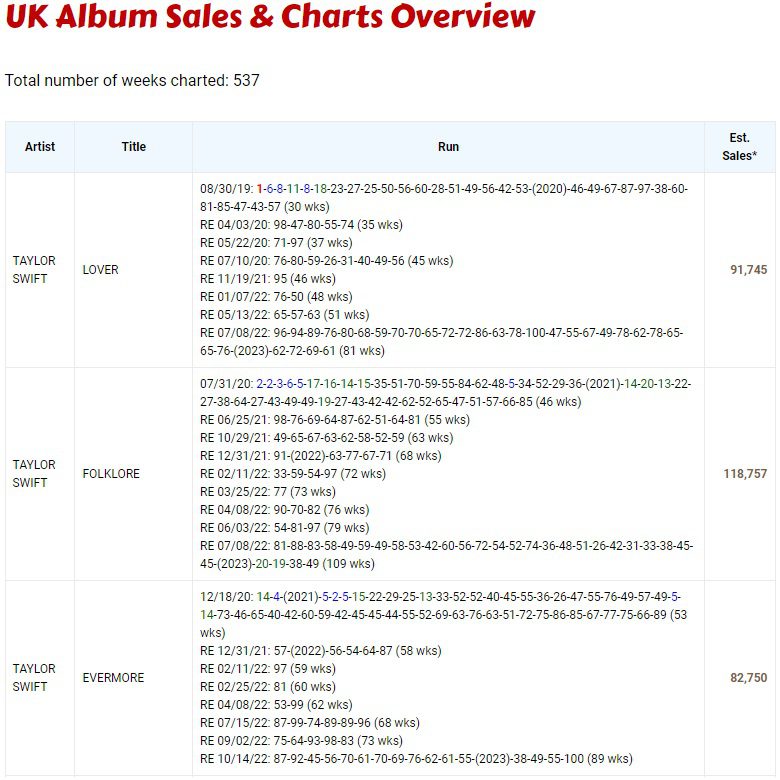
The point is that it’s much faster and more accurate to estimate weekly charts every week than trying to go after each artist one by one. Once we’ve everything ready, we will map these lists with our CSPC scripts.
This way, when a classic album gets a reissue for example, our engine will be aware that it’s overperforming its usual sales trends. It will then extrapolate the data from the charts to global sales according to the artist patterns and increase the album tally.
With the combination of the 3 methods (setting of a new stand-alone estimate, charts-extrapolated data, sales trends) we will be able to maintain sales figures for all artists always updated.
With the new Beta CSPC format allowing us to publish new artists more frequently and pure sales constantly being updated, we finally are able to complete all-time lists within a reasonable timeframe, and maintain them up-to-date from then on!
We’re really excited to work on that and will say more about it when explaining our roadmap a little later. For now, let’s turn to our second target for ChartMasters.
Target#2: Shedding light on streaming platforms other than Spotify
The pain point
With streaming getting a bigger and bigger share of artist’s units, being as close as it gets from their exact numbers is key.
For this reason, we audit results from various platforms covering different markets. We’re auditing Spotify, QQ (China), Genie (South Korea), AWA (Japan), Anghami (MENA), as well as African platforms Boomplay and Audiomack.
Relevant streaming actors like Apple Music, Amazon Music or Deezer do not publish their numbers though. To deal with that, we extrapolate numbers from Spotify based on the global market shares.
One problem remained unsolved up to now. It was the fact that not all artists and genre perform equally well in distinct platforms, like Spotify and Apple Music for example. We now have a solution.

Revolution #3: setting an artist-tailored formula for non-Spotify streaming
Factoring in markets mechanics
For at least 5 years, Spotify has been representing roughly two thirds of total streams in music markets where they have been deployed. With this in mind, a quick estimate is that an international singer with 1 billion streams on Spotify has 500 million more elsewhere.
Now, if a local Swedish singer has 1 billion streams on Spotify, chances are that his streams are close to zero abroad. Why so? Because Spotify has a near 100% market share in its homeland. Similarly, a Japanese artist with 1 billion streams on Spotify will obviously have way more than 500 million streams on Japanese platforms. Country-specific market mechanics cannot be ignored.
This implies that where an artist is getting his streams from is a key to extrapolate accurately his results across all digital streaming services.
Establishing Spotify’s market shares
The first step is to know Spotify’s market share in every relevant market. As it isn’t public information, we went on to audit them ourselves. We went on digging all the data, verifying ratios between known Spotify numbers and national certifications. We completed the jigsaw with the creation of several KPIs to bring solid results.
In the end, we’ve been able to collect information consistent enough to evaluate Spotify’s market share for over 130 countries. They include the 76 countries relevant enough to have their own national chart on SpotifyCharts.com.
The Swedish platform is naturally massively dominant in Scandinavia, but also in Latin America with market shares often over 80%, same as in Spain. It’s worth over 65% in markets like Brazil, Australia or Italy and over 50% in the UK, France, Canada or the US. Their share is way lower in some parts of the world, especially in Asia due to very strong local actors.
This is a highly valuable information, but it still doesn’t tell a thing about the extrapolation of a specific artist. How do we map market figures with artist’s results?
Taking into account where artists are listened to
Our artists global performance page allows you to search for an artist. In this page, you can see his top 50 cities based on the number of monthly listeners.
These top 50 cities often represent as much as 40% of total listeners for international artists, even more for local ones.
We’ve run algorithms on the top 50 list of thousands of artists to understand the share of cities in a country. For example: London in the UK, Paris in France, etc.
By combining those two information, we’re able to infer precisely where an artist’s streams are coming from.
At this point, we are able to apply the extrapolation based on Spotify’s market share on a country by country basis, rather than an averaged number for the entire world.
Identifying the impact of the different music genres
Anyone following charts closely will know that an urban artist will register relatively speaking more streams on Apple Music compared to Spotify than a pop artist in the US.
To address that, we defined 67 different artist profiles, from the US Country singer to the Indian Punjabi star. Indeed, digging into the data, we found out that relevant artist profiles were mainly combinations of a music genre and a language.
A heavy amount of scripting helped us comparing the top cities from the near 40k artists we track to our artist profiles’ templates, automatically identifying the profile for each artist.
Still, knowing the artist’s profile is not quite enough. We need to know how their profile differs from the mean market shares. This part wasn’t too complicated: we have quickly identified patterns with a representative sample.
Back to our example of the Apple Music impact in the US, we now know that pop artists’ on-demand audio streams run approx. 89% higher than their Spotify streams, while urban artists’ totals are 122% higher than their Spotify-only statistics.
Please welcome the artist-specific ratio!
We have then put everything together: Spotify’s national market shares, the distribution of an artist’s listeners, the artist’s profile and what that implies on each platform. With that, we are able to provide a Spotify extrapolation factor unique to each artist.
For artists with a popularity spread out on many markets, we still get a ratio just over 1.5. For example, Elvis Presley stands at 1.52540 and Ed Sheeran at 1.54582.
On the low-conversion end of the spectrum, Swedish hip hop stars Hov1 have a factor of 1.03093, and Latin music’s king Bad Bunny converts with a 1.31442 ratio.
At the other end of the conversion spectrum, Taylor Swift‘s strength in Asia market (where Spotify is not so strong) and relatively lower results in Latin America (where Spotify is huge) make her end up with a strong ratio of 1.71566.
By the way, Taylor Swift‘s recent CSPC update and the ones published afterwards already include this artist-specific ratio. We were indeed testing and refining the automated process lately.
Then there’s Drake, who combines nearly every good spot as he is strong where Spotify is weak and vice versa. His factor is no less than 1.95477.
Let’s take an example of the impact the artist-specific ratio can have on global estimates. Currently, Bad Bunny is fast catching up Drake as the most streamed artist ever on Spotify, with respectively 51b+ and 56b+ equivalent streams. With the artist-specific ratio, our best bet for their cross-platforms audio streams is a much more distant 67b+ versus 110b+.
Target#3: Upgrading the streaming tool’s reliability
Speaking about industrialization, it’s not possible to succeed without the good tech. Let’s get to our third target: upgrading the streaming tool’s reliability.
The pain point
Spotify’s data is tricky to handle. Their daily figures updates are not performed at the same time every day, and they last about an hour, during which the same song can have 2 distinct playcounts when it’s part of multiple records. Due to this, our most streamed artists list is regularly impacted with glitches despite our algorithms working to detect invalid datasets.
This also implies we display updates sometimes several hours after Spotify is done updating their data.
Additionally, the streaming tool regularly seems to be slow, you may forget to retrieve the numbers and won’t be able to get them afterwards, etc.
We’ve now upgraded our tool to avoid these issues.
The key to reliability – securing the figures’ date
Rather than trying to understand if an artist data is valid or not when our users search for them, without control on the timeframe or the evolution of an artist catalog, we changed the core of the model.
We’ve set schedulers to audit a representative dataset to know when the daily update starts and ends. That way, we can avoid saving the data during this span, avoiding duplicates. Knowing the figures’ date opens an impressive spectrum of possibilities, so we coded them.
For example, since we can safely date figures, when new numbers are in, we can save them. And once today’s numbers are saved, when another user checks the artist’s results, they are served instantly. Because we can retrieve the data immediately from our database rather than process the whole scan on Spotify’s side.
Industrializing the scanning process
This is only the beginning. Knowing for sure the data’s date allows us to largely industrialize the scanning process.
For example, we can schedule very popular artists to be scanned as soon as we know the new numbers are in. As many artists are searched multiple times every day, scheduling the scan is making the tool way faster for you.
In the past, if a duplicate managed to get saved, the artist streams were left unsaved for many days. Indeed, our scripts were detecting that the new numbers were lower. This won’t happen anymore.
The new tech still saves a total which goes down for example, as some tracks can be removed. This total will be flagged as suspicious and the next time around, the scanning process is re-done. If the new data is fixed, we switch to it. If it remains the same, the model understands that the previously saved data was wrong, and stick to the new one.
Let’s go a step deeper into the process. As we can detect suspicious numbers and save breakdowns, we can automatically check and retrieve the tracks which have been overlooked when this happens, and list down these records which tend to fail for some reason.
Ultimately, the model is now some kind of AI, learning from the data, fixing day after day the flaws, to make sure that catalogs remain complete, with no more data glitches.
From sparse on-demand updates to scheduled ones
Fresh and reliable streaming data everywhere on ChartMasters
Naturally, with more processes executed through schedulers and more and more data available from our various tops, to not slow down the server, we need to reduce on-demand executions.
Silver members have no Spotify tool searches as part of their plan, but an exception remained for members who first logged in the past when 3 daily searches were granted. We’ll have to remove this by the end of March.
This way, rather than depending on random searches to get new data for major artists, we are planning to automatically update daily streaming numbers of all CSPC artists in the coming weeks.
The better control of the date of updates enables us to display the effective date of the data available before a search. It’s another way to reduce the workload, and for users to not waste a search to see the new data while it has yet to arrive. Similarly, a warning will tell data is unstable when the new daily figures are incoming but not yet complete.
These updates will of course impact all streaming tops with fresh and reliable data for all artists. And from now on, the tops will be updated earlier in the day than they were previously.
New features for fans
While we need to make a priority to fulfil our role, providing comprehensive and updated rankings entirely for free, we also hear you fans loving to look up your favorite artist’s data.
Based on what you regularly tell us, we are already thinking about a subscription that would be affordable and include a special discount for students.
Our ambition for this plan so far is that it will enable you to define who’s the artist you are interested in, so that his data will be scanned and automatically saved every day.
Then, you’ll access to a screen where you could look up your artist’s streaming numbers and the breakdown for a selection of dates (for example the last 14 days). We could also imagine sending a daily notification when new numbers are in or allowing data exportation.
Please tell us your thoughts and what features you would wish or love to have. The final result is only as good as the inputs given!

Target#4: Making detailed data searchable and sortable
The pain point
Figures are never as meaningful as when they are confronted to other figures. So far, while career totals have been available on cross-artists lists, once we get into detailed statistics it takes to browse multiple CSPC articles to see how artists compare to each other.
Even inside an article, when we are interested by a specific song or compilation, for artists with large discographies it may get difficult to find the data in the middle of very large pictures.
Searchable and sortable tables
From now on, pure sales of most formats inside CSPC articles will be listed inside searchable and sortable tables. It will make articles smoother, easier to digest.
Outside of artists’ pages, our Data Collector was the easiest way to see most figures. It was mainly made of flat text lists though.
All pages have now been entirely automated. Figures from all lists will be kept updated by script on top of the aforementioned search and sort features. This includes the ASR ranking that was frozen for years until this update.
An example of that is that with this system we can quickly check among all artists studied who sold the most albums in Germany, Australia or so.
On top of that, we can also introduce some cool features, like a rolling CSPC over a span of years that you can define. Thanks to this, if you wonder where Taylor Swift ranks since she debuted, you only need to check total sales from material released from 2006 to now.
As we have been setting up our technical environment to deal with all the data, there can be some very slight differences between screens until everything is sorted, but the bulk of figures are in their final version already.
No need to say that this opens a lot of possibilities in terms of data visualization. Do not hesitate to add a comment if there are filters or views that you would like to see implemented.
Wrapping it up
What we will do
ChartMasters has been implementing a full set of technical tools to provide more features, more consistency while unleashing our ability to publish more content.
Beta CSPCs will be released to pace up the process, and pure sales will join streaming figures as data that will remain automatically updated over time.
The extrapolation of streams across all audio platforms will be sharply improve thanks to insightful algorithms which bring artists-tailored information about non-Spotify streams.
To fully exploit this new capabilities, we are adding new scripts, screens and views to store and browse the data more conveniently.
How we will do it
Our ambition for the coming months is to drop Beta CSPCs as fast as we can. We will test the format and process over the next weeks, slightly adjusting what needs to be. And then, we will roll out the remaining artists.
We will continue following the requests’ leaderboard‘s sequence order. Only the way we deal with them will change.
Obviously, already existing articles do not contain the automatic update of sales or the artist-tailored extrapolation of Spotify streams.
Once we consider these changes as must-haves, it’s tempting to update all articles. There, we face the same question about our paradigm. Is it better to estimate many artists with a bigger error margin or to estimate very well fewer artists?
As we speak about updates, it’s a no brainer. Let’s say an artist was published with 200 million sales and moved 10 million units since then. In this case, estimating 209 million or 211 million will always be better than sticking with 200 million.
The next step for us is to move these historical multi-pages CSPC articles to the new 1-page CSPCs, factoring in all the new features listed here.
This will also add the data from all artists into the various views which are getting rolled out, completing the jigsaw.
You’ve got it, the next months will be very busy with plenty of publications. ChartMasters enters its industrialization era!