High School Musical albums and songs sales
Every record is worth buying if it puts a smile on the face of your children. Teen pop music and the Disney industry are two prime examples of this reality. When the power of both are merged together, it may result into Britney Spears, Justin Timberlake, Christina Aguilera, Hannah Montana, Miley Cyrus or… the High School Musical cast.
Exactly 10 years ago this week, the trilogy’s second volume has debuted at #1 in the US with an impressive 615,000 copies sold. Let’s bring back some memories studying this highly popular franchise!

There is no doubt that Zac Efron & friends were huge. The TV series was watched by millions, the DVDs sold past 25 million units worldwide and the third movie, Senior Year, was issued in theaters all over the globe banking in more than $274 million.
What about their music though?
The single Breaking Free spent one week inside the Top 10 in both the US and the UK, at #4 and #9 respectively. What Time Is It? had a brief peak at #6 in the US also, but that’s it. No other single from the High School Musical franchise charted higher than #20 in both countries. They had no continuity whatsoever and no song from those movies managed relevant airplay.
So, while the series was popular inside the entertainment industry, was it really big inside the music industry? How have their three albums performed? And what about their singles? Are their songs still streamed to this day or was it all about a temporary hype?
ChartMasters’ method: the CSPC
As usual, I’ll be using the Commensurate Sales to Popularity Concept (CSPC) in order to relevantly gauge the act’s results. It will not only bring you sales information for all albums, physical and download singles, as well as audio and video streaming. In fact, it will really determine the act’s popularity.
If you are not yet familiar with the CSPC method, below is a nice and short video of explaining the concept. I recommend watching it before reading on and to the sales figures. You’ll get the idea in just two minutes.
And if you want to know the full method as well as formulas, you can read the full introduction article.
Now let’s get into the artist’s detailed sales figures!
High School Musical original albums sales
NB: N/A means no specific number is available. Sales from the country are still accounted for in the Worldwide estimate by using figure patterns of both the artist and the country market. Countries not displayed in this fixed panel are also factored in.
High School Musical (2006)
:format(jpeg):mode_rgb():quality(40)/discogs-images/R-8698279-1466850645-7689.jpeg.jpg)
- America
- US – 5,000,000
- Canada – 220,000
- Argentina – 170,000
- Brazil – 200,000
- Mexico – 290,000
- Asia – 230,000
- Japan – N/A
- Oceania
- Australia – 115,000
- New Zealand – 50,000
- Europe – 2,420,000
- UK – 1,300,000
- France – 125,000
- Germany – 240,000
- Italy – 175,000
- Spain – 165,000
- Sweden – 25,000
- Netherland – 30,000
- Switzerland – 10,000
- Austria – 35,000
- Finland – N/A
- World – 9,000,000
High School Musical 2 (2007)

- America
- US – 3,500,000
- Canada – 150,000
- Argentina – 95,000
- Brazil – 175,000
- Mexico – 170,000
- Asia – 190,000
- Japan – N/A
- Oceania
- Australia – 105,000
- New Zealand – 35,000
- Europe – 1,970,000
- UK – 850,000
- France – 90,000
- Germany – 290,000
- Italy – 200,000
- Spain – 130,000
- Sweden – 25,000
- Netherland – 20,000
- Switzerland – 20,000
- Austria – 45,000
- Finland – N/A
- World – 6,600,000
High School Musical 3: Senior Year (2008)

- America
- US – 1,550,000
- Canada – 145,000
- Argentina – 50,000
- Brazil – 145,000
- Mexico – 265,000
- Asia – 140,000
- Japan – N/A
- Oceania
- Australia – 120,000
- New Zealand – 30,000
- Europe – 1,470,000
- UK – 500,000
- France – 115,000
- Germany – 250,000
- Italy – 175,000
- Spain – 115,000
- Sweden – 15,000
- Netherland – 15,000
- Switzerland – 15,000
- Austria – 20,000
- Finland – N/A
- World – 4,025,000
Original Album Sales – Comments
2006 High School Musical – 9,000,000
2007 High School Musical 2 – 6,600,000
2008 High School Musical 3: Senior Year – 4,025,000
Bang! If airwaves were flooded with Rihanna and Nelly Furtado by then, the High School Musical albums were selling just as much. In fact, the first volume topped the IFPI Annual list of Worldwide top sellers for 2006. With 6 million album sales, it was just ahead of Stadium Arcadium by the Red Hot Chili Peppers. The series replicated the feat in 2007 with the second volume topping the list at 6,3 million, with Amy Winehouse second at 5,6 million with the classic Back To Black.
This is where the total of 19,6 million albums sold is truly impressive – it happened in no time at all. During the three years from 2006 to 2008, no artist sold more albums than the High School Musical cast. To be comprehensive, they haven’t sold only 19,6 million albums as remix, karaoke and live sets quickly emerged too. We are going to meet them under the remaining long formats section.
Physical Singles Sales
As a reminder, the weighting is done with a 10 to 3 ratio between one album and one physical single.
By 2006, the physical single format was dead in the US and songs from High School Musical 3 barely charted in Europe and Australia, the very places where physical singles were still being sold. This is forgetting the strength of the teens market.
The CD single What Time Is It? was released to much fanfare in the US, a country where singles weren’t topping 200,000 units for years. It went on to sell more than 370,000 units there to make it easily the highest selling physical single of 2007. The entire market was up to 2,4 million singles sold that year, meaning What Time Is It? amounted for 15,4% of all US sales for 2007.
High School Musical (2006) – 42,000 equivalent albums
Breaking Free – 120,000
We’re All in This Together – 20,000
High School Musical 2 (2007) – 153,000 equivalent albums
What Time Is It? – 440,000
You Are the Music in Me – 30,000
Gotta Go My Own Way – 20,000
Remaining Singles – 20,000
High School Musical 3: Senior Year (2008) – 6,000 equivalent albums
Now or Never – 20,000
Digital Singles Sales
As a reminder, the weighting is done with a 10 to 1,5 ratio between albums and digital singles.
Teen acts are among the best examples to illustrate that digital sales of singles truly replaced album sales in terms of consumption. As previously mentioned, the High School Musical LPs had no successful hit. No airplay means no digital sales. Most members of the general public never heard these tunes.
Still, this page shows they sold a total of 14 million downloads. How come? If one checks carefully, they will notice the same phenomenon that happened with Justin Bieber, One Direction and Hannah Montana, e.g. consistent sales over the entire track lists, rather than a couple of hits selling a lot. This is due to kids liking High School Musical but at times with no money to buy the albums. Instead, they had access to iTunes with gift cards to consume. Our Commensurate Sales to Popularity Concept relocate accurately this behavior by translating downloads of singles into equivalent album sales, more than 2 million in the case of this franchise.
High School Musical (2006) – 975,000 equivalent albums
Start of Something New – 1,000,000
Get’cha Head In the Game – 700,000
What I’ve Been Looking For – 600,000
Breaking Free – 1,600,000
We’re All in This Together – 800,000
Remaining tracks – 1,800,000
High School Musical 2 (2007) – 758,000 equivalent albums
What Time Is It? – 600,000
You Are the Music in Me – 650,000
I Don’t Dance – 400,000
Gotta Go My Own Way – 850,000
Bet on It – 550,000
Everyday – 600,000
Remaining tracks – 1,400,000
High School Musical 3: Senior Year (2008) – 420,000 equivalent albums
Now or Never – 350,000
Right Here, Right Now – 300,000
I Want It All – 200,000
A Night to Remember – 250,000
Can I Have This Dance? – 600,000
Remaining tracks – 1,100,000
Streaming Sales
Streaming is made up of two families – audio and video. Our CSPC methodology now includes both to better reflect the real popularity of each track. The main source of data for each avenue is respectively Spotify and YouTube. As detailed in the Fixing Log article, Spotify represents 132 million of the 212 million users of streaming platforms, while YouTube is pretty much the only video platform generating some revenue for the industry. Below is the equivalence set on the aforementioned article:
Audio Stream – 1500 plays equal 1 album unit
Video Stream – 11,750 views equal 1 album unit
Equivalent Albums Sales = 212/132 * Spotify streams / 1500 + YouTube views / 11750
Part 1
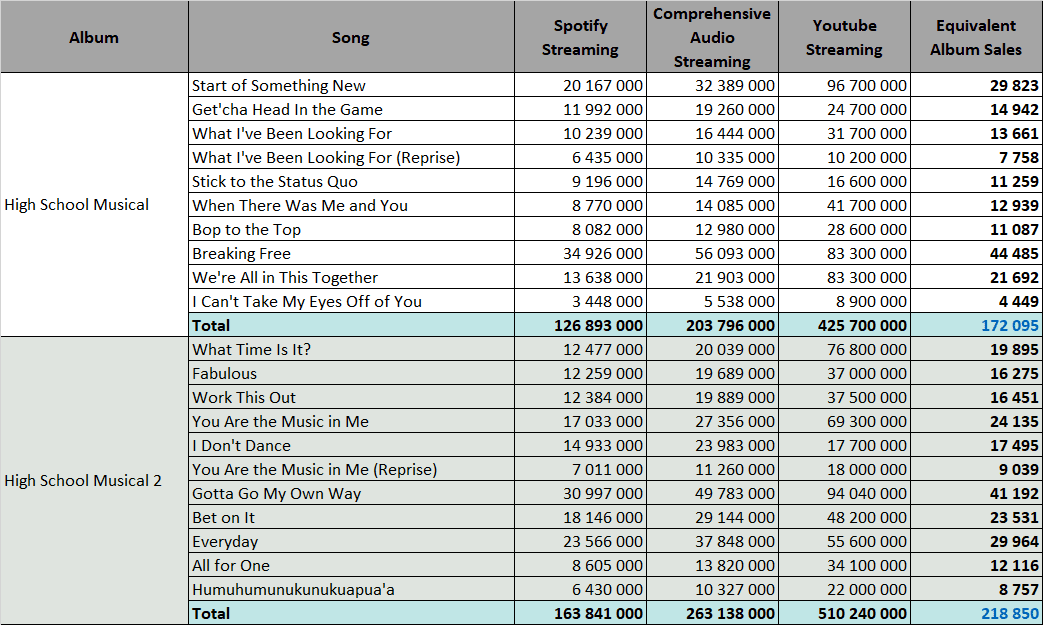
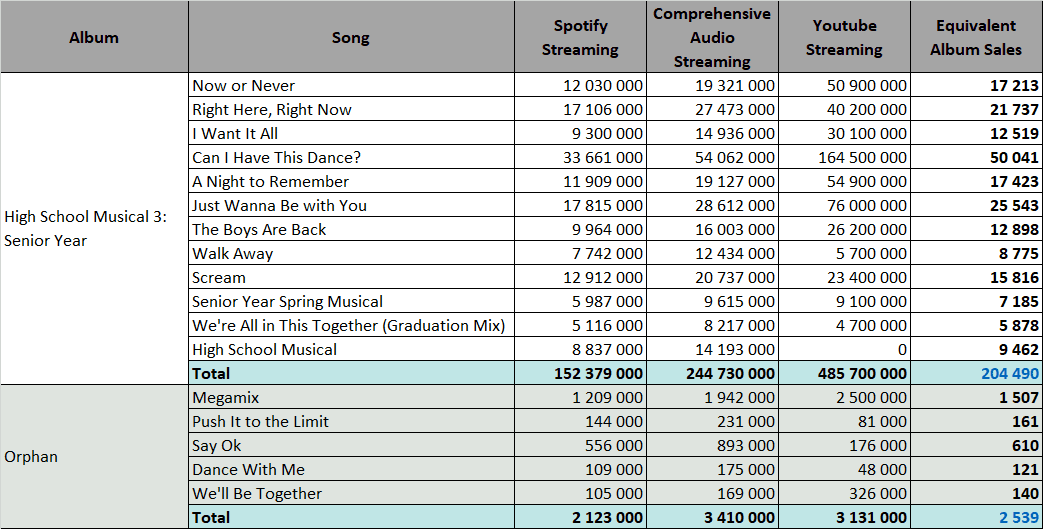
The teen acts patterns continue to be verified with all High School Musical results. Their streams are incredibly consistent with no real gap between the supposed hits and unknown album tracks. All of them have many millions of streams on both Spotify and YouTube. The second volume even ends up being the very first album we met which has all its tracks at 17 million or more views on YouTube.
This consistency pays off as in spite of the lack of hits, both albums enjoy respectively 172,000 and 219,000 equivalent album sales from streams.
Part 2
Spotify totals of their albums: 1 has 127 million streams, 2 has 164 million, and 3 has 152 million. YouTube totals of their albums: 1 has 426 million views, 2 has 510 million, 3 has 486 million.
The linearity is absolutely incredible, not only inside one tracklist, but over all 3 of them. The third volume is just as strong as its predecessors with 204,000 equivalent album sales to date.
Full Length related record Sales
It sounds fairly logical to add together weighted sales of one era – studio album, physical singles, downloads, streams – to get the full picture of an album’s popularity. For older releases though, they also generate sales of various live, music videos and compilation albums.
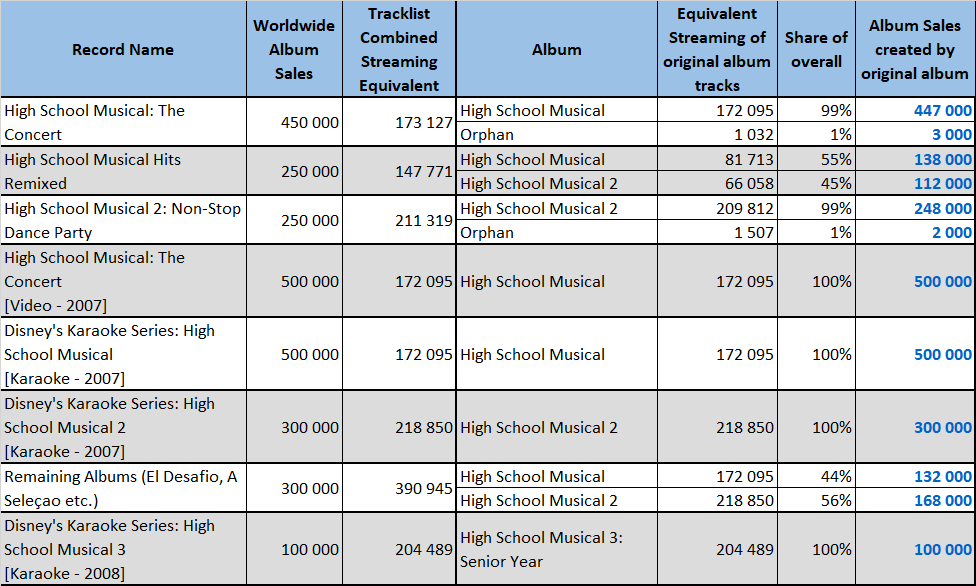
All those packaging-only records do not create value, they exploit the value originating from the parent studio album of each of its tracks instead. Inevitably, when such compilations are issued, this downgrades catalog sales of the original LP. Thus, to perfectly gauge the worth of these releases, we need to re-assign sales proportionally to its contribution of all the compilations which feature its songs. The following table explains this method.
How to understand this table? If you check for example the The Concert live album line, those figures mean it sold 450,000 units worldwide. The second statistics column means all versions of all the songs included on this package add for 173,000 equivalent album sales from streams of all types.
The second part on the right of the table shows how many equivalent streams are coming from each original album, plus the share it represents on the overall package. Thus, streaming figures tell us songs from High School Musical are responsible for 99% of the The Concert track list attractiveness. This means it generated 447,000 of its 450,000 album sales and so forth for the other records.
Almost all of them are themed around one specific volume which gets rewarded sales of those secondary packages. Once again, it isn’t surprising to see so many random sets issued in no time. These kind of eras generate a lot of fans with parents wiling to pay for many gifts to make their child happy. Majors know how to take full advantage of that and drop at a fast pace live, remix or even karaoke records to maximize their profits.
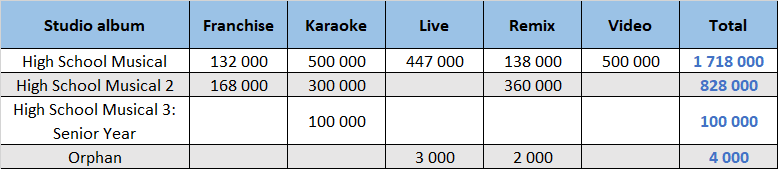
Full Length related records Sales – Summary
Here is the most underestimated indicator of an album’s success – the amount of compilation sales of all kinds it generated. Due to the dependency of sales of the original studio albums on these releases, they are a key piece of the jigsaw.
The hype was impressive with High School Musical. In less than one year tons of packages came out in various formats, all of them moving notable amounts in their respective categories. Combined, they are worth 1,7 million for the record.
BONUS: Total Album (all types) Sales per Country
-
- America
- US – 11,010,000
- Canada – 620,000
- Argentina – 380,000
- Brazil – 700,000
- Mexico – 830,000
- Asia – 600,000
- Japan – N/A
- Oceania
- Australia – 370,000
- New Zealand – 125,000
- Europe – 6,200,000
- UK – 2,800,000
- France – 360,000
- Germany – 880,000
- Italy – 600,000
- Spain – 460,000
- Sweden – 70,000
- Netherland – 70,000
- Switzerland – 50,000
- Austria – 110,000
- Finland – N/A
- World – 21,775,000
- America
Please note that some of the countries totals may be slightly incomplete when the figure is N/A for minor releases. Countries with too much missing information to be precise enough are listed as N/A.
High School Musical CAREER CSPC RESULTS
So, after checking all the figures, how many overall equivalent album sales has each High School Musical album achieved? Well, at this point we hardly need to add up all of the figures defined in this article!
In the following table, all categories display figures that way, e.g. in equivalent album sales. For example, singles from High School Musical released in digital format sold the equivalent of 975,000 albums – 6,500,000 downloads with a 10 to 1,5 weighting.
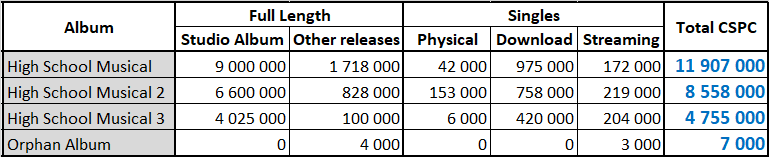
The flying TV series High School Musical went on to sell 25,2 million equivalent albums with a lifespan of barely 3 years. Each volume contributed greatly. The first one is on 11,9 million units, the second is up to 8,6 million while the third volume is on 4,8 million.
The streaming figures are interesting. With nearly 600,000 equivalent album sales from this avenue, the soundtracks are still increasing to this day. The days of Zac Efron playing Troy and Vanessa Hudgens playing Gabriella may be long gone, but the franchise’s popularity isn’t over.
As usual, feel free to comment and / or ask a question!
Sources: IFPI, Spotify, YouTube, Chartmasters.org.
Bonuses
BIGGEST TRACKS – High School Musical
The list of most successful songs is compiled in album equivalent sales generated by each of them. It includes the song’s own physical singles sales with a 0,3 weighting, its download and streaming sales, and with appropriate weighting too, plus its share among sales of all albums on which it is featured.
- 2006 – Breaking Free [High School Musical] – 3,130,000
- 2006 – Start of Something New [High School Musical] – 2,010,000
- 2007 – Gotta Go My Own Way [High School Musical 2] – 1,550,000
- 2006 – We’re All in This Together [High School Musical] – 1,520,000
- 2008 – Can I Have This Dance? [High School Musical 3: Senior Year] – 1,150,000
- 2007 – Everyday [High School Musical 2] – 1,120,000
Records & Achievements
- High School Musical was the global #1 seller of 2006 with 6,0 million physical units shipped.
- High School Musical 2 was the global #1 seller of 2007 with 6,3 million units shipped.
- The High School Musical cast is the first artist to achieve back to back #1 global seller on consecutive years since the Beatles achieved this feat in 1968 and 1969 with the White Album and Abbey Road.
We have more for you…
… checking out the upcoming artists or even voting for them!
… similar artists
… best-selling artists, albums, and singles