Titanic albums and songs sales
You’rree heere, there’s nooothing I feaarr
And I knoooow that my heart will.. go oonnn
We’llll staay foreeeever this way
With these lyrics in our mind and the song will go on and on
It has now been 20 years since the release of the earthquake titled Titanic. The movie, its actors, the VHS, the DVD, the Soundtrack, its theme song, everything about it was utterly massive. During 4 months the entire World kept watching a ship sinking.
James Horner was naturally elected to compose the Soundtrack of this juggernaut project. The American conductor passed away in a plane crash 3 years ago this week. Before the sad event, he rose to fame thanks to his works on Star Trek, Aliens, Braveheart and Apollo 13 among others.
At first, the composition of the Titanic Soundtrack was given to Enya, who refused it. The Irish theme of the album made her an obvious first choice. Music tainted with Irish and Celts sounds was also incredibly popular at the time thanks to diverse acts like the aforementioned Enya but also the Corrs, ERA, the Cranberries and the huge Riverdance show. Horner perfectly translated these influences into the soundtrack. He was assisted by Norwegian legend Sissel who contributes with background vocals all along the record. Horner also added lyrics to one song and recorded it with the biggest global singer of the time: Céline Dion. The rest is history.
ChartMasters’ method: the CSPC
As usual, I’ll be using the Commensurate Sales to Popularity Concept (CSPC) in order to relevantly gauge the act’s results. It will not only bring you sales information for all albums, physical and download singles, as well as audio and video streaming. In fact, it will really determine the act’s popularity.
If you are not yet familiar with the CSPC method, below is a nice and short video of explaining the concept. I recommend watching it before reading on and to the sales figures. You’ll get the idea in just two minutes.
And if you want to know the full method as well as formulas, you can read the full introduction article.
Now let’s get into the artist’s detailed sales figures!
Original Albums Sales
Titanic (1997)
- America
- US – 11,400,000
- Canada – 1,175,000
- Argentina – 140,000
- Brazil – N/A
- Mexico – N/A
- Asia – 6,775,000
- Japan – 1,700,000
- Taiwan – 1,325,000
- China – 1,150,000
- South Korea – 700,000
- Hong Kong – 200,000
- Oceania
- Australia – 410,000
- New Zealand – 75,000
- Europe – 6,900,000
- UK – 1,050,000
- France – 1,690,000
- Germany – 1,425,000
- Italy – 260,000
- Spain – 480,000
- Sweden – 180,000
- Netherlands – 180,000
- Switzerland – 210,000
- Austria – 135,000
- Finland – 75,000
- World – 28,510,000
Original Album Sales – Comments
1997 Titanic – 28,510,000
Apart from the raw result of 28,5 million copies sold which is already stunning, there is two more facts that are nothing else than amazing.
The first is how incredibly global the soundtrack was. It was the first international album to sell over 1 million copies in Taiwan, achieving the same feat in China. It sold nearly as many units in Asia than in Europe.
The second is the pace of sales. Issued in mid-November 1997, the soundtrack gained traction after the release of the movie one month later. It climbed 154-72-31-11-1 in US weekly charts, remaining on top 16 weeks in a row. By the end of March, the record had already shipped over 19 million units. That’s roughly 210,000 sales per day during the entire first quarter of 1998. One year later, by the end of March 1999, official data was up to 27 million units shipped by Sony. Vertiginous.
Several elements shot down its catalog sales quickly. One of them is the release of Céline Dion‘s compilation All the Way in November 1999. Still, at 28,5 million pure units, the album remains among the highest selling records of all-time.
Physical Singles Sales
As a reminder, the weighting is done with a 10 to 3 ratio between one album and one physical single.
Only one physical single was released to support the soundtrack, but it wasn’t a weak one. My Heart Will Go On was everywhere. By March 2000, a mere two years and a half after its release, more than 70 million albums containing the song had been shipped. It wasn’t only good in supporting albums, it also did wonders on its own.
By then, physical singles were mostly an European thing, with both the US and Australia being great markets too. In these last two markets though, the release of My Heart Will Go On was limited. In spite of this, the single shot to #1 in all countries. In all but New-Zealand where the CD single wasn’t issued at all to make more room for the album.
The physical single sold more than 4,6 million units in Germany, the UK and France. Since its release to date, no other song sold that much in this format.
Titanic (1997) – 2,073,000 equivalent albums
My Heart Will Go On – 6,910,000
Digital Singles Sales
As a reminder, the weighting is done with a 10 to 1,5 ratio between one album and one digital single.

Although it came out many years before the arrival of iTunes, the popularity of My Heart Will Go On was still strong during the digital age. With 1,75 million downloads in the US and large numbers in Asian markets too, the song registers an impressive 4,47 million digital units sold. While it comes nowhere near to All I Want for Christmas Is You by Mariah Carey, it is still one of the greatest selling catalog female song from the 90s.
Titanic (1997) – 753,000 equivalent albums
My Heart Will Go On – 4,470,000
Remaining tracks – 550,000
Streaming Sales
Streaming is made up of audio and video streams. Our CSPC methodology now includes both to better reflect the real popularity of each track. The main source of data for each avenue is respectively Spotify and YouTube. As detailed in the Fixing Log article, Spotify represents 157 million of the 272 million users of streaming platforms, while YouTube is pretty much the only video platform generating some revenue for the industry. Below is the equivalence set on the aforementioned article:
Audio Stream – 1500 plays equal 1 album unit
Video Stream – 11,750 views equal 1 album unit
Equivalent Albums Sales (EAS) = 272/157 * Spotify streams / 1500 + YouTube views / 11750
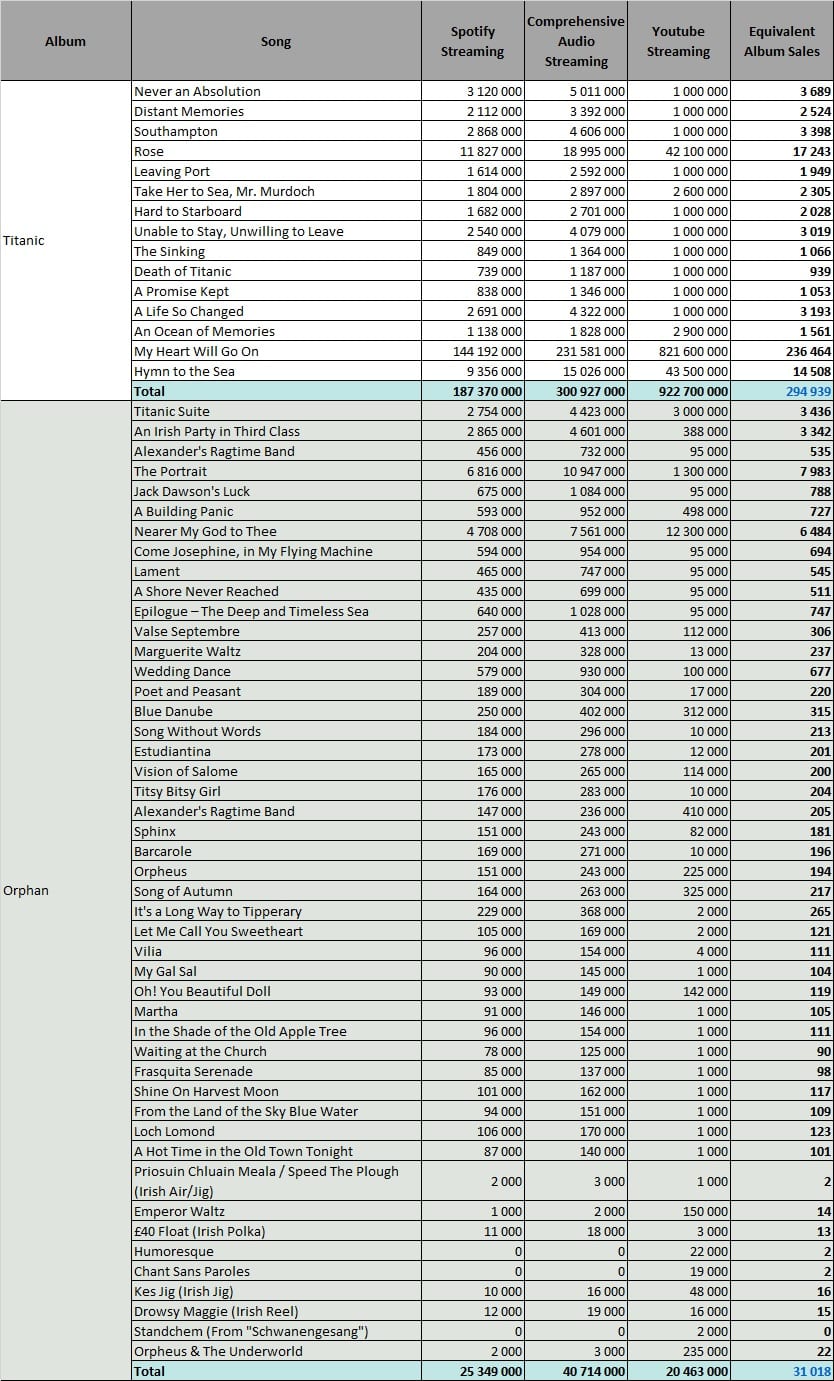
Streaming Part 1
As every successful release, the soundtrack of the Titanic was ultimately treated as a franchise. A second album, Back to Titanic, was soon released. It contained additional songs with the same theme and new performances of the songs from the first album. Basically, it was an extended remix album of the first. These additional songs and more related to the Titanic are listed here.
The biggest song is obviously My Heart Will Go On. This tune is now up to 144 million Spotify streams and more than 820 million YouTube views. Surprisingly, the full theme does well on streams. Rose, which is the love theme of the movie also used as a background to My Heart Will Go On, has 12 million streams on Spotify and 42 million on YouTube. Hymn to the Sea does nearly as well.
Full Length related record Sales
It sounds fairly logical to add together weighted sales of one era – studio album, physical singles, downloads, streams – to get the full picture of an album’s popularity. For older releases though, they also generate sales of various live, music videos and compilation albums.
All those packaging-only records do not create value, they exploit the value originating from the parent studio album of each of its tracks instead. Inevitably, when such compilations are issued, this downgrades catalog sales of the original LP. Thus, to perfectly gauge the worth of these releases, we need to re-assign sales proportionally to its contribution of all the compilations which feature its songs. The following table explains this method.
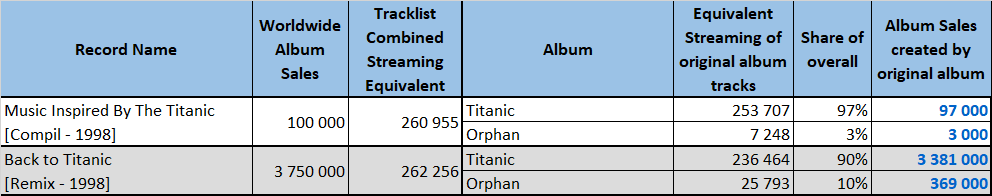
How to understand this table? If you check this example, these figures mean Back to Titanic sold 3,750,000 units worldwide. Then, the second statistics column means streams of all the songs included on this package add for 262,256 EAS.
The second part at the right of the table shows how many streams are coming from each original album as well as the share they represent. Thus, streaming figures tell us Titanic songs are responsible for 90% of the Back to Titanic tracklist attractiveness. In other words, it generated 3,381,000 of its 3,750,000 album sales.
It is clear that even orphan songs are a mere extension of the Titanic Soundtrack. For this reason, all numbers will be merged together in totals.
TITANIC CSPC RESULTS

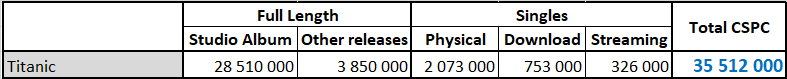
So, after checking all the figures, how many overall equivalent album sales has the Titanic soundtrack achieved? Well, at this point we hardly need to add up all of the figures defined in this article!
In the following table, all categories display figures that way, e.g. in equivalent album sales. For example, singles from Titanic released in digital format sold the equivalent of 753,000 album albums – 5,020,000 downloads with a 10 to 1,5 weighting.
As a reminder:
- Studio Album: sales of the original album
- Other Releases: sales of compilations generated thanks to the album
- Physical Singles: sales of physical singles from the album (ratio 3/10)
- Download Singles: sales of digital singles from the album (ratio 1,5/10)
- Streaming: equivalent album sales of all the album tracks (ratio 1/1500 for Audio stream and 1/11750 for Video stream)
Conclusions
In spite of the dilution of its appeal into external releases in later years, the Titanic soundtrack registers a massive total of 35,5 million equivalent album sales. It makes the album the 9th most successful of the 90s, although it ranks only 3rd among November 1997 releases. In fact, both Céline Dion‘s Let’s Talk About Love and Shania Twain‘s Come On Over were issued the same month.
Additionally, the next sections list its most successful songs as well as its records and achievements.
As usual, feel free to comment and / or ask a question!
Sources: IFPI, Spotify, YouTube, Discogs, Chartmasters.org.
TITANIC’S BIGGEST TRACKS
The list is compiled in album equivalent sales generated by each song. Therefore, these figures are not merged units of singles formats. Instead, it includes weighted sales of the song’s physical single, download, ringtone and streaming as well as its share among sales of all albums on which it is featured.
1. 1997 – Céline Dion – My Heart Will Go On [Titanic / Let’s Talk About Love] – 29,310,000
2. 1997 – James Horner – Rose [Titanic] – 1,710,000
3. 1997 – James Horner – Hymn to the Sea [Titanic] – 1,440,000
Please note that the total of 29 million from My Heart Will Go On refers only to sales related to Titanic products. Obviously, it also fueled sales of Céline Dion‘s records. The comprehensive CSPC tally of this recording is displayed below:
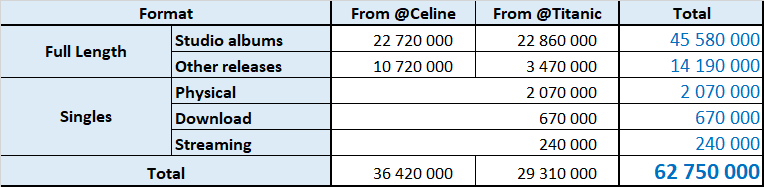
As shown in the all-time list, this figure of 62,75 million EAS from My Heart Will Go On makes it the most successful song ever.
RECORDS & ACHIEVEMENTS
- At 62,750,000 EAS, My Heart Will Go On is the most successful song of all-time.
- At 35,512,000 EAS, Titanic is the 9th most successful album of the 90s.
- The Titanic soundtrack is the first and only million selling international album in Taiwan.
- The Titanic soundtrack is the first and only million selling international album in China.
- The Titanic soundtrack shipped more than 18 million pure copies during the first quarter of 1998.
- At 6,91 million, My Heart Will Go On is the highest selling physical single since December 1997 to date.
NB: EAS means Equivalent Album Sales.
We have more for you…
… Celine Dion‘s full CSPC analysis
… Celine Dion‘s streaming masters analysis
… checking out the upcoming artists or even voting for them!
… similar artists
… best-selling artists, albums, and singles
Artists
360° analytics – Best-Selling Artists | by Decade
Tools: Artist Dashboard | Artists Comparator
Streaming deep dive – Most-Streamed Artists
Tools: Playcounts | Royalties | Global Reach | Stats History
Other KPIs – Monthly listeners | Followers | Top money makers
This article is being discussed in our forum, join us to share your comments! »