Understanding: Billboard BB200 vs US Album Sales
https://flic.kr/p/oYUCbe
I) Establishing Key Formulas
E) Fixing The Factor
The first four sections of this article are interesting but it still remains obscure. It is so because of one element missing – the factor. We know how the market evolved, we know how sales are scaled over a ranking, we know how to elude traps from the RIAA and from atypical rankings. We don’t know how to convert the scale and the market into a formula factor.
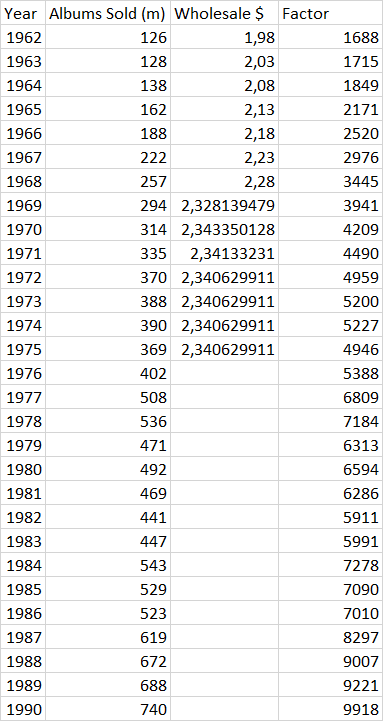
It happens to be fairly easy to set. It requires entering all elements into the sheet and then try various factors until finding the one that fits with RIAA awards for all albums, which means our conversion makes sense. The one that came out is 5,200 for 1973.
For example, we scaled positions 101-200 with 1. It means that in 1973, when 388 million albums were sold, albums charting between 101-200 were averaging 5,200 sales a week. The factor for every year is automatically calculated as per the market evolution as listed below: