Learn how to exploit YouTube Insights

Have you ever wondered where your favorite artist was truly big? In which country he has sold large quantities of albums without the news breaking traditional online boards? When he started to be popular and with which records? Answers are out there. Continuously disregarded until now, find out how insanely powerful YouTube Insights is.
What’s YouTube Insights?
For several years now YouTube has been providing an analytics tool named Music Insights. On it, you can get plenty of details about views of an artist or a geographical area during a certain period of time.
Lists related to a city or a country are fascinating. You can learn a lot about demographics and market dynamics from it. The article today focuses mostly on the artist view though. Our target is to point out a solution to know when, where and how much an artist has been successful in markets usually off the radar.
The data
The big question with merged YouTube views is always the same one: which videos are counted, and which aren’t? Statistics from YouTube Insights are based on YouTube’s Content ID. What’s this?! When you are a rights holder of a song, say a record label, you can request YouTube a Content ID. It tells to YouTube that every time a video related to that Content ID is viewed, they have to pay you royalties. Of course, all official videos from artists’ Vevo channels involve a Content ID.
There is more though. When a rights holder detects a video is using his song, he can either ask for the video to be removed, track its views or add his Content ID to be paid his royalties on it. Basically, an unlimited number of videos can be linked to the same Content ID as soon as the music is used on it.
Data presented on YouTube Insights is based on views of the Content ID. It means that includes more than the official video of a song. It also means that just like Gold and Platinum certifications, it requires an action from the record label to be processed correctly. The difference is that YouTube views bring them money, so all labels have employees tracking and managing these Content IDs.
Please note that songs can also have multiple Content IDs. If for some reason a label has distinct agreements for the studio and the live version of a track he may ask for two distinct ones. Similarly, the label can also aim to track distinctly its official videos and users-added content.
You will notice that most views counts are lower than the ones you can see when playing a stand-alone video. It’s down to the tracking period. On Insights, the data used to go back to September 2014 but has since been partially purged. Right now, it goes from December 30th, 2016 to date.
These limitations make it look like YouTube Insights data is incomplete and unreliable, which is why it is massively ignored online. That’s a tremendous mistake. While YouTube Insights isn’t the place to go to know release to date views totals, there is just so, so much more to learn from it. We will see that its relevance is all about organic volumes so the shorter period and the Content ID constraints aren’t an issue at all
The screen
How can you access it? It’s simple, just follow the link.
The top of the screen looks like below with the example of Dua Lipa:
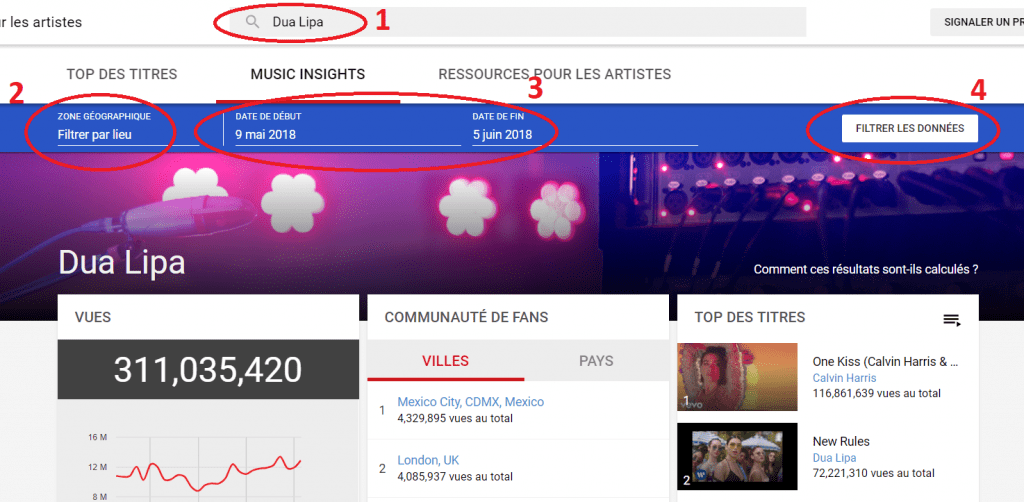
Before anything, you don’t need to worry because of titles in French. I’m currently living in a French-language country, but YouTube adjusts it depending on your own place.
The red ellipse 1 enables you to filter an artist or a geographical area. The latter can be a city, a district or a country. Please note that you have to wait for the auto-completion and press on the result that fits your query for results. Both filters, artist and place, are limited to the data processed by YouTube. For example, Dadju, the little brother of Maitre Gims who recently smashed in France with his single Bob Marley, hasn’t been added to their database. Teams of YouTube are incredibly efficient though. They don’t stop to add newly popular artists. It already includes several thousands of singers so you will most likely find out what you are looking for right now or soon enough.
Red ellipse 2 is a purely geographical filter. Thanks to it, you can combine both filters, the artist and the area. You will then learn that Dream On is far and away the most viewed track of Aerosmith in the US, but only the 14th with less than 2% of views of I Don’t Want to Miss a Thing in Japan.
The red ellipse 3 is the date filter. As previously mentioned, the data goes from December 30th, 2016 to date. Validate all your filters by pressing the button displayed on red ellipse 4.
The artist view
Once you selected an artist, there is various additional information as shown below.
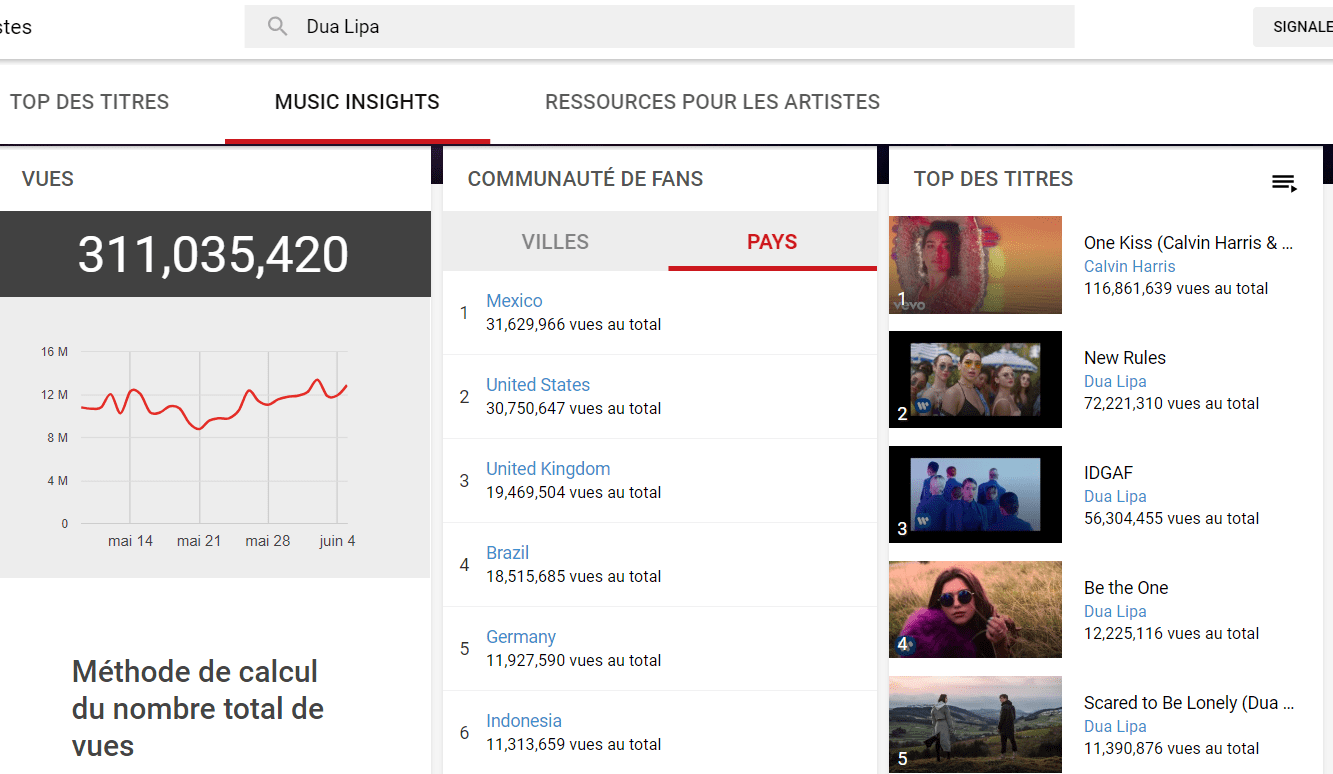
At the left, you can mouse over the red curve under the “Vues” (= “Views”) section to see the exact count of views per day.
The section in the middle displays both the Top 100 cities (link “Villes”) and countries (link “Pays”). Our example tells us that during the last rolling month Dua Lipa has been streamed more on YouTube from Mexico than from the US and Indonesia is her 6th market. The default screen only displays Top 10s, but there is a “PLUS (100)” button at the end of each list.
At the right, you can see the list of her Top 10 songs over the selected period. It is extendable to a Top 20 thanks to the “PLUS (20)” button at the end of the list.
Once again, you can combine filters together. Thus, you can see Dua Lipa‘s ranking from all countries and cities. Her One Kiss represents more than half of her views in the UK, but it is outperformed by both New Rules and IDGAF in Indonesia.
Raw data doesn’t matter, only their meaning do
I always insist a lot about the fact that identifying receipts is the easy and most irrelevant part of the charts and sales game. What really matters is the analysis part. I’ll explain it once again because it is truer than ever with YouTube views which by themselves are hardly valuable.
If you follow media news, you likely heard that the last Star Wars movie, Solo, is bombing hard. After 13 days, it grossed $158 million in the US while the previous 3 episodes produced by Disney stood at $359-$629 million at the same point. Worst, it is already down to a daily pace of $2,5 million when its predecessors were still registering $18-$28 million a day.
When Disney bought the franchise a few years ago, they looked at the numbers and though Star Wars was a massive cash-in machine. At some extent, they were right. They forgot the meaning of numbers though. If each Star Wars episode was grossing so much, it wasn’t because of the Star Wars universe only. People wanted to know the main storyline. What happened, why, and what’s going to happen next. If an episode brings absolutely nothing to that storyline, there is no reason to be excited about it and less to pay $10 to see it. Portraying a character inside the same background universe is pointless and numbers of Solo prove that. A book about the childhood of Ronald Weasley that’s independent from Harry Potter would bomb just as much.
The lesson learned is that we need to understand what the data really stands for and what it ultimately really means. Limiting our work to collect YouTube Insights numbers to convert them into sales would be absurd. Let’s open that gold mine and see everything we can learn from it.
How to interpret YouTube Insights’ information

The organic nature of YouTube views
Just like people don’t go to theaters see Star Wars like robots, they watch YouTube videos for a reason. They do it when they heard about an artist, so they want to know what it is about. Or they listened to a song on radio that they liked and want to stream it back. Or they are fans of the artist and simply consume their music through YouTube because they can’t afford paying for it. We stream a video for a reason and we do it consciously.
In other words, a video stream is an organic consequence of success rather than the root cause. All elements which create organic video views today were also generating organic records sales in the past.
I have been going through YouTube Insights for a pair of years, putting head-to-head views of an artists with his sales in each country. The most striking conclusion is that there is a blatant correlation between streams and sales.
That’s where this tool is incredible. It contains data from all countries. Charts and sales information has always been limited to a restrictive number of markets. For some artists and records, more data leaked, but overall most questions about sales in Asia, Eastern Europe or Latin America were left unanswered. People aiming to know where artists were doing well and how much they sold globally had to leave huge holes or to go into hazardous and biased estimations. Instead, we can retro-engineering YouTube Insights’ data to get clear, precise and facts-based figures for all records, in all markets.
It’s all about relativity
The main error about the retro-engineering of YouTube statistics would be to believe you can directly deduce how many copies an album sold with a basic multiplier. It isn’t because an artist has millions of views in Vietnam that he sold millions there. Additionally, it isn’t because it is streamed more in Mexico than in the US that he sold more there. Last but not least, it isn’t because an artist has more views than someone else with an old song that he sold more in the past.
The strength of YouTube varies a lot depending on the market. Demographics will also be more favorable for some artists. Obviously, Barbra Streisand‘s lovers aren’t hard core YouTube users, while the zillions of people who viewed PSY‘s Gangnam Style haven’t buy his albums. In short, absolute numbers of views are irrelevant.
Proving the point
Now if I tell you that over the last 4 weeks, the US represented 61,3% of Janet Jackson‘s views, 29,7% of Mariah Carey‘s ones but only 22,9%, 13,6% and 12,1% for Whitney Houston, Madonna and Céline Dion respectively, you start thinking that it means something. Thanks to record’s sales, we already knew the relative US importance for these artists, but can you tell me which one did the best in virtually all countries? YouTube Insights can.
Among these artists, the one having the highest share of her streams coming from the Philippines and Taiwan is Carey. Surprised? Of course not, her success in Asia is well known. In Mexico though, she registers a mere 1,8% of her views, that stands against 8,5% for Madonna. All divas get from 2% to 3,8% of their streams from France, all except Dion who has a stunning 10,2% of her views from there alone.
As you can see, we can challenge their data through tons of examples and it just works. The relative strength of each markets for all artists can be deduced from YouTube Insights’ statistics. That’s incredibly powerful.
For example, you will be interested to know that while Carey (2,7%) has expectedly way more views in proportion from Indonesia than Houston (1,4%), Madonna (0,7%) and Jackson (0,3%), she is topped by Dion at 3,6%. We can wonder if it’s due to the overwhelming success of My Heart Will Go On in Asia. It’s not, that song actually has a lower weight in Dion‘s Indonesian views at 21,3% than Carey‘s Hero on hers at 24,1%.
Insights just ended to tell us a real, valuable information: Dion is especially massive in Indonesia. We must mention that Indonesia was the biggest Asian market for international artists besides Japan during the 90s. This example shows how much of a mistake it is to ignore YouTube Insights when working with charts and sales.
As shown with the aforementioned case of Aerosmith, apart from the distribution of streams per country, we can also extract the relative strength of each song. Thanks to that, we can gauge accurately which era was successful for an artist in a specific market.
Convinced of the interest of this amazing tool? It’s time to see how we can work it out to extract priceless data.
Valuation of an artist’s popularity per market

Millions of supposed sales unaccounted for
For decades, various sales myths have been entertained for one simple reason: we were lacking data about many markets. If detailed information about sales in the US, the UK, Japan, Germany, etc., doesn’t sustain a suspicious claim, the answer is easy: “there is many more countries in the world”. These days are over.
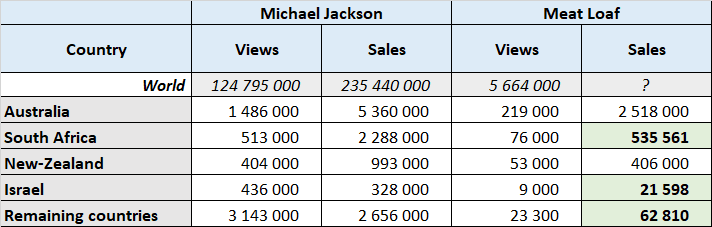
Among the wildest claims were the ones related to Meat Loaf‘s 1977 monster album Bat Out Of Hell. During the last decades, the album’s reported sales went from 25 to 37 to 43 million. This last figure is still the one claimed on Wikipedia. The information about this LP is quite special. On one side, we have detailed and official data proving gigantic sales in various countries while there is absolutely nothing known for remaining markets. It is a blockbuster in the US (15 million as of now), the UK (3,3 million), Australia (near 1,8 million, highest selling album ever), Canada (2,25 million), Netherlands (over 1,1 million added to the volume 2) and New-Zealand (17xP, 255,000).
Then there is various countries were the album sold a lot without reaching all-time highs levels. While there is no recent data from Germany confirmed, it is 100% safe that the album shifted well over a million to date. It shipped 500,000 units up to 1983, added over 300,000 copies in 1993-1994 plus more than 30 years of solid catalog sales. The record did nearly as well in Austria and in Switzerland. Similarly, charts tell Meat Loaf is a solid seller in Scandinavia.
This set of mind-blowing figures can lead anyone to assume monster sales in remaining markets too. After all, there was limited to no information in 1977 from countries like Brazil, Mexico, Japan, France, Italy and Spain. Why couldn’t it be there too a sales beast which accumulated tons of sales through the years?
Views by market: Meat Loaf vs Michael Jackson
To know where an artist like Meat Loaf sold well, we need to set a point of reference. I’ll go with Michael Jackson for 3 main reasons. The first is that he is one of the most global artists of all-time, registering solid views from everywhere. Thus, he is representative of a widespread appeal, his views aren’t weighted towards a few markets only which would distort comparisons. The second reason is that we have album sales information for him from a lot of markets, so we can set up various conversions. The third reason is that his main singles came out from 1979 to 1995, in line with Meat Loaf‘s 1977-1994 big years, so their big hits are equally old.
We will compare the relevance of each country for both acts. Below table lists results for the American continent. They include views of both acts for the last 4 weeks.
Views in America

How to read these figures? If you check the line of Canada, data means Jackson registered 1,813,000 views there during the last rolling month, 1,5% of his global views of near 125 million. On its side, Meat Loaf stands on 240,000 in Canada, 4,2% of his global views of under 6 million. It means that Canada is a market 2,92 times more important for Meat Loaf.
Bat Out Of Hell went 2xDiamond in Canada in 1995 when it was 12xPlatinum in the US. Bat Out Of Hell II went 9xPlatinum in the former country against 5xPlatinum in the latter. This factual situation is verified with YouTube Insights data which confirms his higher popularity in Canada than in the US.
It gets very interesting in the lower part of the table. We notice that everywhere else in the American continent, Meat Loaf is nowhere near as popular as in Canada and the US. There is a string of Central American and Caribbean countries where he isn’t even that bad. In South America though, that’s a disaster. Brazil is a market 15 times less important for him than for Jackson. That’s despite the fact we are speaking in relative terms, ignoring that in absolute terms he is already much lower.
Views in Europe
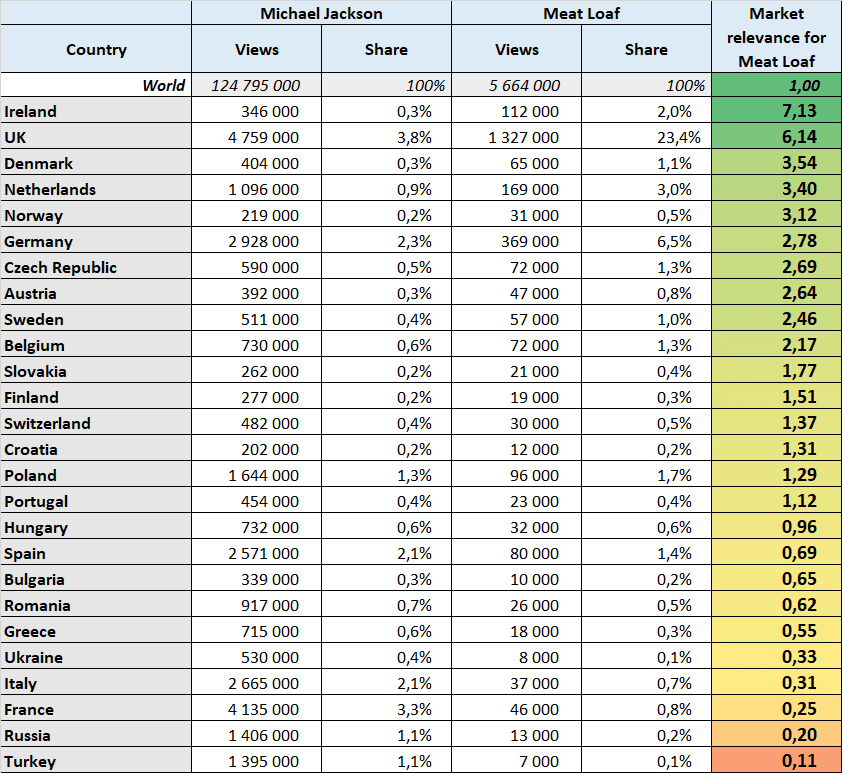
The UK and Ireland represent 25,4% of Meat Loaf‘s global streams against only 4,1% for Jackson. While we don’t know sales of Bat Out Of Hell in Ireland, we can safely assume they are just as good as in the UK. Then there is 7 countries which are from 2,5 to 3,5 times more relevant for Meat Loaf. They are exactly the countries where we already knew he was big: Scandinavia, Netherlands, Germany, Austria and Czech Republic.
It’s kinda incredible to see all figures fitting so well: in both Belgium (2,17) and Switzerland (1,37) the relevance of Meat Loaf is almost equal to the weighted average of Netherlands / France and Germany / France / Italy, respectively.
Interestingly, we notice that he is less popular than expected in Finland. Bat Out Of Hell 1 & 2 are uncertified there. Since the Finnish database is far from complete, we could have assumed huge sales, on par with the rest of Scandinavia still. The 3rd chapter of the album issued in 2006 completely missed the Top 40 there when it reached the Top 10 in Sweden, Norway and Denmark. These YouTube Insights’ data now confirm that: he simply sold less in Finland than elsewhere.
In Spain, the relevance of 0,69 is already very low. We must understand that since Meat Loaf failed to do well in huge YouTube markets like Brazil and Mexico, the norm for him would be to over-perform in the rest of countries the share of someone equally big everywhere like Jackson. Consequently, being more than 30% sub-par is quite bad.
In fact, when we see France at 0,25 we shouldn’t suppose Meat Loaf is 25% as successful as Jackson there. The latter sold over 14 million albums in this country, the former only charted inside the Top 50 one time, with Bat Out Of Hell 2 which peaked at #19 on a short run and failed to go Gold. When we know that the gap in sales is about 30 to 1 for a ratio of 0,25, we understand how poorly Meat Loaf sold in Latin America where his ratio is even lower.
Views in Asia
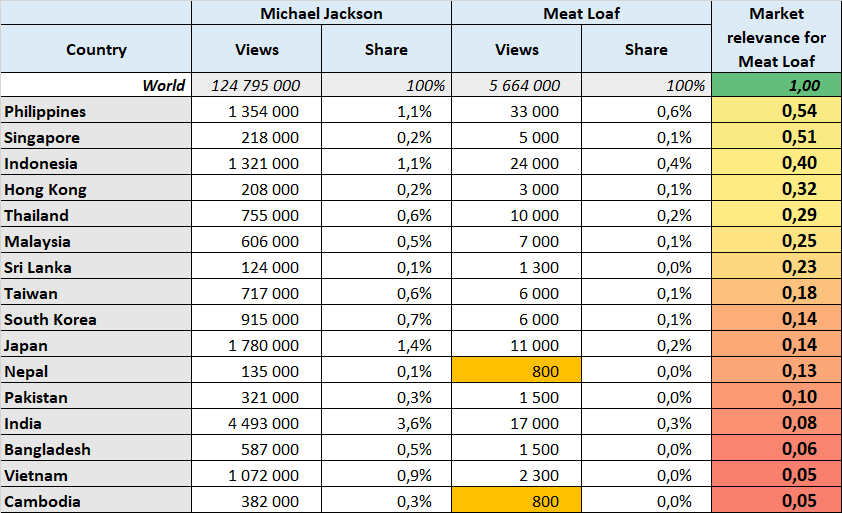
If you wondered if Bat Out Of Hell sold tons of copies off the radar in Asia, here is the answer: no, it didn’t. Figures are very clear, Meat Loaf is barely known there. Please note that orange cells at 800 refer to countries outside of his personal top 100, so I have set 800 as it is the cut of that top 100, the truth is even lower.
Logically, countries were he isn’t that awful in terms of performance are the ones where there is many English-language expatriates. When we check the various releases of some of his albums like Bad Attitude, we can highlight it got released in Japan, Philippines and Indonesia from Asia. That’s precisely the biggest Asian markets when we factor his organic popularity to the market size. It confirms he was at least selling a bit there, but elsewhere his records weren’t even issued.
Views in the rest of World
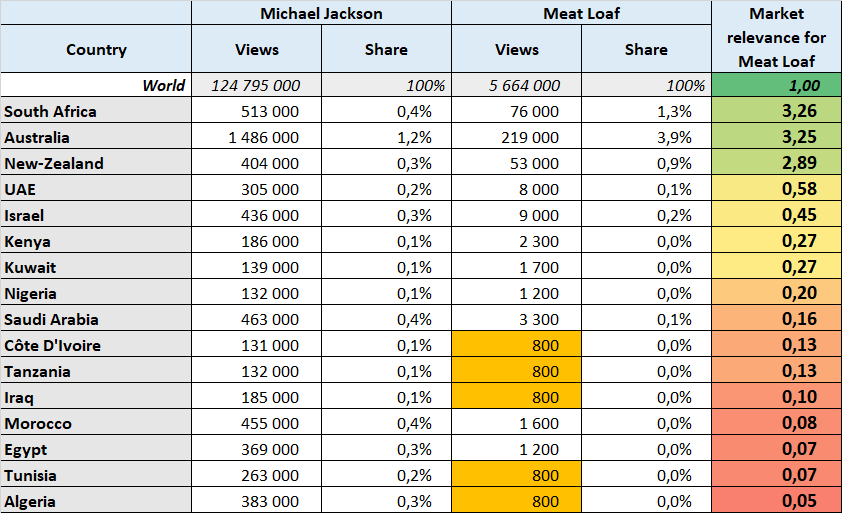
Once again no surprise. We knew Meat Loaf did well in Australia and New-Zealand, this is confirmed by his YouTube numbers. We can now also safely say he sold a lot in South Africa. It doesn’t come as a surprise either since we already pointed out that African markets are almost entirely driven by expatriates, which in the case of South Africa come from English-speaking countries where he is big.
As for the remaining Middle East and African countries, while these markets are already fairly low, he also performed poorly. Basically, his records never came out and the local population clearly never heard about him and his albums.
The conversion rate
Thanks to previous tables, we saw that we can have a very clear view of markets where an artist did well or not. How does it translate into sales though?
Below are markets were we have enough information to commit into a career to date tally for both Jackson and Meat Loaf. Figures exclude some minor releases, but it doesn’t alter the conclusions nor the meaning of it. The important point is how sales translate into views.

What does relative conversion rate means? For each markets, it’s how many more sales Meat Loaf recorded from the same number of views. In the US for example, for every view Jackson got during the last month, he sold 2,69 albums during his career. Meat Loaf sold 13,66 albums for each of his views. It’s all the more natural since Jackson has a larger part of his audience which uses YouTube than Meat Loaf.
In Canada, Australia and New-Zealand, the conversion rate is almost identical. In the US it is much higher, in the UK much lower. Why so? In the US, Meat Loaf has been a one-franchise-wonder. The first two volumes of Bat Out Of Hell represent 85,6% of his sales there. It means that even if they liked only 3/4 songs from him, they still bought up to 2 albums, which are studio ones so they don’t cannibalize each other.
In the UK, he was much more successful, hitting the Top 10 with 12 albums against only 2 in the US. That raised the interest in compilations. He sold nearly 4 million of them in the UK. Basically, Meat Loaf suffered the cannibalization effect mentioned inside the Artist Success Rating article, which is the result of a poor exploitation of the catalog of an artist. Ultimately, while his catalog was way more popular in the UK / Ireland than anywhere else, that popularity wasn’t converted so well into sales.
The question is, which conversion rate is the most representative of sales elsewhere? The average of all 5 rates is 3,25. Both the US and the UK are outliers data, the remaining ones are all around 3,2 too. Let’s simply go with the average of these three markets at 3,19. Now, we will see how Jackson‘s views from each country translated into sales and assume Meat Loaf converted his own views 3,19 times better. Once again, be aware sales by country of Jackson may be slightly incomplete. The aim isn’t to build a receipt list but instead to understand the meaning of figures and how to interpret the mechanics of sales.
Sales in American continent
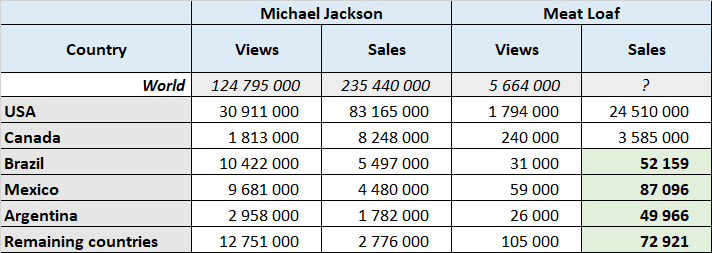
As you can see, applying our conversion rate results on a mere 262,000 sales for Meat Loaf in all American countries outside of the US and Canada. We aren’t talking about sales of 1977’s Bat Out Of Hell, but instead his career to date total.
For sure, these figures aren’t official sales nor real data. In the absence of known information though, they are a realistic set of facts-based figures. They involve no opinion and no assumption that isn’t based on accurate information. Maybe even more importantly, results doesn’t depend on market sizes only, they also take into account the relative popularity of the artist in each country. Let’s continue to display results of Meat Loaf.
Sales in European continent
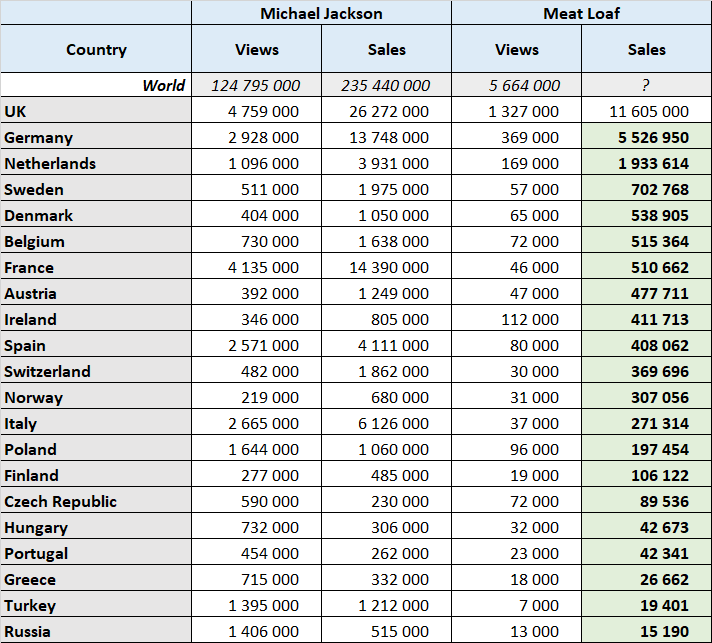
What’s good with European countries is that we have data to verify how accurate this method is. In Germany, a quick overview tells us Meat Loaf must have sold close to 5 million albums with both Bat Out Of Hell 1 and 2 well over a million a piece. In the Netherlands, these albums sold nearly 1,1 million up to 2006. While the rest of his discography sold nowhere near as well, the calculation of 1,9 million is too high but in the correct ballpark.
Data we have about his album sales in Sweden, Denmark, Austria, Spain, Switzerland, Norway, Italy and Finland are all consistent with the figure suggested by YouTube Insights’ conversion, although for most of them just like in Germany and the Netherlands numbers are a bit too high. That’s most likely down to the huge conversion rate of Michael Jackson in Europe which inflates slightly numbers in favor to Meat Loaf.
Please note that for Ireland the conversion rate from the UK was used since the market follow the same trends.
Sales in Asian continent
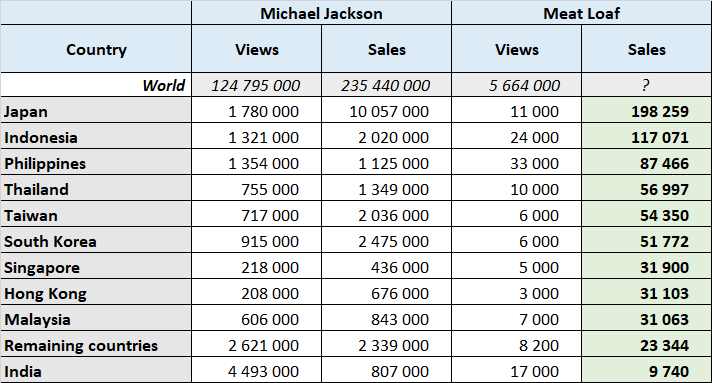
I previously mentioned that taking into account the market size and Meat Loaf‘s relative popularity, Japan, Indonesia and the Philippines are his 3 biggest markets from Asia. Results confirm it in full. It’s no coincidence if they are the markets that got the most releases from him as shown on discogs.
We do have one unique sales information about Meat Loaf in Asia: Bat Out Of Hell 2 sold 3,250 in its only week charted in Japan. How would I process without YouTube Insights? It would be all about the pace of sales. In all markets for which we have information we can notice the album during its peak in late 1993 sold around 1/20th of its release to date total. That would set its sales over 60,000 units in Japan. This market is more frontloaded than remaining ones though so one would expect less than that mark. Bat Out Of Hell 2 made a much larger impact than Bat Out Of Hell in Japan since that one failed to chart despite much lower numbers required, although YouTube views suggest a great lasting appeal of the first. In countries where that situation has been true, that would suggest 100,000-ish sales for the first album, 50,000-ish for the second and about the same for remaining albums and compilations. That would put him on 200,000 units. The same result as the one we obtain with YouTube Insights.
It’s kind of fascinating to see that two completely different methods, one based on the pace of sales from release to date and the other on YouTube views, result on exactly the same number. Once again, it doesn’t mean Meat Loaf necessarily sold 200,000 albums in Japan, but it does mean that is an accurate gauge of the truth and that he sold nowhere near as well as in some other markets.
In total, all markets add for close to 700,000 units. In reality, that would be a bit less because of release issue. These calculations suppose all his albums were released in all countries, just like Jackson‘s albums were. It isn’t true. When we see under 10,000 sales for India, across a catalog as large as his and over a country as massive as India, we can seriously doubt his records were ever released there. It wouldn’t have been profitable for his label. Instead, the few views obtained would be due to expatriates and people on vacations.
Sales in remaining countries
Please note that for South Africa the conversion rate from the UK was used since the market follow the same trends.
Global sales of Bat Out Of Hell
Bat Out Of Hell sold 22,65 million units in the 5 known English-speaking countries, the US, the UK, Canada, Australia and New-Zealand. To be at 43 million globally, that would require more than 20 million sales from remaining countries; Thanks to YouTube Insights, we can gauge Meat Loaf‘s sales elsewhere on 14 million, give or take possibly up to 20%. But that figure refers to his entire discography, not only his debut album. Even if we assume the 1977 record sold half of these sales from elsewhere, it still means only about 7 million, which puts it under 30 million to date.
This result isn’t surprising. In fact, careless media from all over the world repeat 37 or 43 million without looking what it is about. In truth, these figures always refered to combined sales of Bat Out Of Hell I and II.
That brings a new question, how do we know which album did well? Guess what, YouTube Insights give us the answer once again!
Valuation of an artist’s popularity per era

Not all artists started big. Some took many years and albums before breaking over. Acts like Aerosmith, the Red Hot Chili Peppers and Green Day are good examples. Then you have acts like Kylie Minogue who were globally successful with some albums but less with others. This creates several doubts. If we speak about the latter, how can we know her sales from everywhere while only post-Fever (her 2001 smash album) data is enough documented in most markets?
The artist’s consistency
The case of Minogue is typical of many artists in terms of available sales information. We know a lot about one album – charts and / or certifications from more than 30 countries for Fever – but much less from her remaining records. Thus, we would like to extrapolate Fever‘s data into the rest of her discography. If we look at her sales, it doesn’t seem possible. Her first two albums, Kylie and Enjoy Yourself, add for nearly twice as many sales as Fever in the UK but less than half in the US. With sales patterns so different depending on the country, we don’t know how to work it out. Still, we can do it thanks to YouTube Insights.
Below table lists the share of video streams among Minogue‘s catalog from her #1, #3, #5, #10 and #20 most viewed songs from multiple markets. Please notice I selected views from the month of January 2018 to avoid specific case of Christmas songs and newly released singles. Let’s see what we can learn from that:
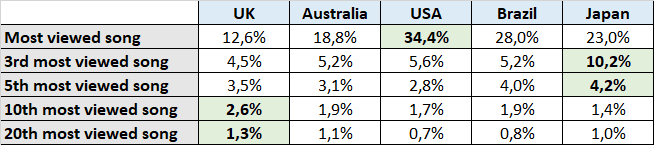
How should we interpret this table? It suggests Minogue is the closest to a one-hit-wonder in the US, where her most viewed song represents over 34% of her views. It’s not surprising since that’s where she sold the least relatively speaking outside of the Fever era. Then we can notice her 1-5 songs are the closest in Japan. Once again that’s consistent with album sales since her 4th top LP seller there sold as much as 54% of her biggest studio album in this country against at most 28% elsewhere.
The last 2 lines show how consistent an artist has been. Logically, her views are more spread over her entire catalog in the UK, followed by Australia. In the other side of the spectrum, her low Top 20 songs in the US register very low streams.
These figures prove a real correlation between sales of an artist’s albums and views of their related songs on YouTube. They tell how large a fanbase is and how much an artist crossed over the main audience. It doesn’t tell us which era did well or not though. We will now value them.
Top 20 Songs ranking highlights highest selling albums
In the previous page, I mentioned each artist has a conversion rate. Depending on how much his audience fits with YouTube’s audience, views will suggest different number of sales achieved through the years. It’s also true inside the discography of an artist.
The debut album Kylie sold nearly as much as Fever, but its songs are viewed much less. It’s fairly natural since Kylie video clips are much older and much cheaper, while those of Fever are pretty iconic. Still, knowing that each song has a distinct conversion rate, we can still compare their performances in diverse countries. Please notice all sales figures mentioned below come from Minogue‘s CSPC article.
YouTube Insights provide us with the 20 most viewed songs of each artist in each country. Below is the ranking of Minogue‘s songs in 5 large markets:
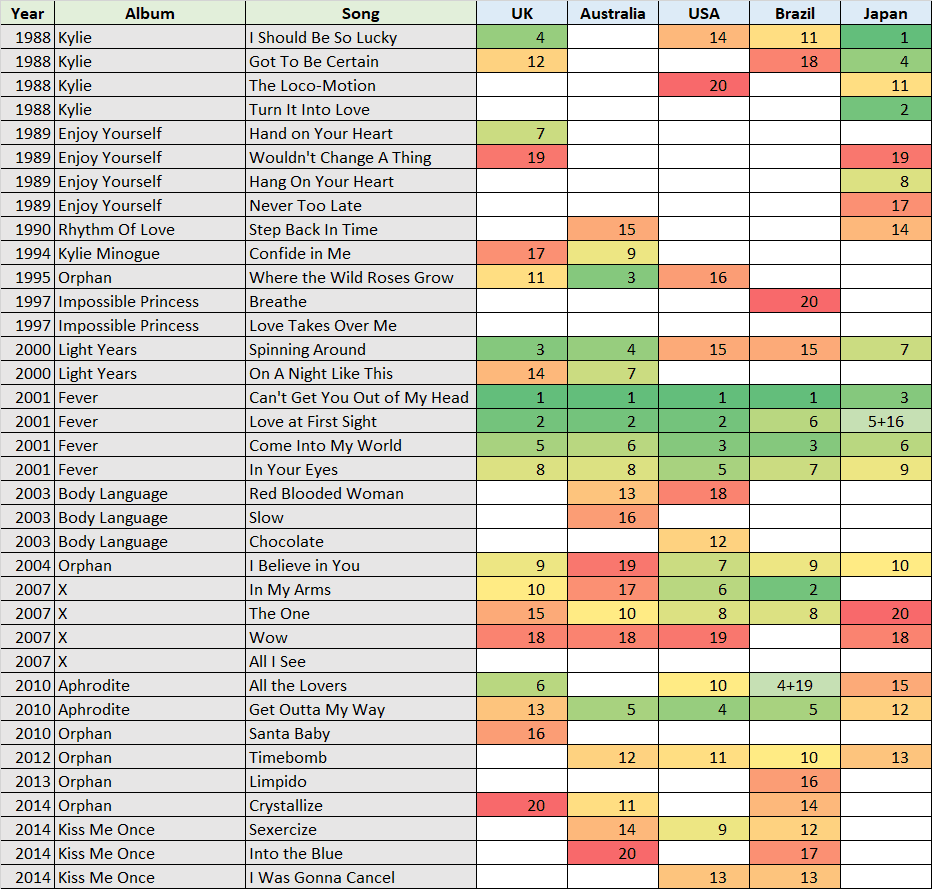
An incredible interconnection
There is a lot of highly valuable information in this table. Early hits are still very strong in Japan. It’s indeed where they did the best relatively speaking. Her first 3 albums plus compilations and remixes made of their hits sold 750,000 albums there against only 205,000 for Fever. In the same way, the first two albums combined outsold by almost 2 to 1 Fever in the UK, while they sold less than it in Australia. Thus, we see their songs perform much better in the former country.
There is only 2 markets where 1990’s album Rhythm of Love sold almost as much as Enjoy Yourself. That’s Japan and Australia. They are also the only two markets where its single Step Back in Time features inside Minogue‘s current Top 20.
Then there is 2 countries where Kylie Minogue from 1994 strongly outsold 1991’s Let’s Get To It, the UK and Australia. They are also the only two markets where its single Confide In Me features inside Minogue‘s current Top 20. Light Years was huge in these countries while so-so elsewhere, we can clearly see it with rankings of Spinning Around and On A Night Like This.
Cross-checking album sales when available with songs’ views highlight a true organic link. Consequently, why not use views when data related to album sales is missing? For example, there is no chart nor certification nor publication about the album Kylie‘s sales in Brazil. Has it sold 0 copies, 25,000, 100,000 or 500,000? That’s a huge hole left unanswered without YouTube Insights.
Both I Should Be So Lucky and Got To Be Certain are among Minogue‘s Top 20 most viewed videos in Brazil. They haven’t got popular in recent years just like that. If they are still played to this day, it’s because they were successful back then. They are outside her Top 10 though, so we can’t assume she was as big there than in the UK and in Japan. We also pointed out previously that her discography isn’t very consistent in Brazil, so her low Top 20 songs are less valuable that they are in the UK for example. Indeed, their rankings as well as the distribution of her views are closer to her US statistics. There, Kylie sold half the sales of Fever. This latter album moved 75,000 units in Brazil, so one would expect 30,000 to 50,000 sales to be a valid and realistic range of sales for Kylie. Incredibly easily, we narrowed a range from 0-500,000 to 30,000-50,000, which represents a margin of error of less than 0,4% of Kylie‘s global sales.
Can we confirm this ballpark with additional facts?
Gauging sales from poorly documented markets
All statistics posted below were related to stand-alone songs. What happens when we check all singles from one album and compare their views to album sales?
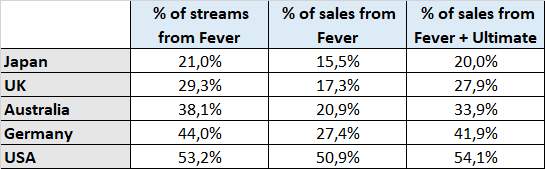
The best of Ultimate from 2004 sold a large part of its copies thanks to Fever singles. When we compare the share of views of these singles among Minogue‘s catalog, we see they perfectly match the share of sales from Fever plus Ultimate among her discography.
How about applying this method to countries where sales of various albums are unknown?
We will use Brazil once again. Fever plus Ultimate sold an estimated 84,000 units there and all her remaining records since 2001 to date sold 65,000 units. Fever‘s singles account for 40,2% of Minogue‘s streams on YouTube, which puts Brazil in-between Australia and Germany. Consequently, we can calculate that Fever plus Ultimate represent about 37,1% of album sales to date in Brazil. As they sold 84,000 units, it would mean her catalog sold 226,000 copies overall. Once we take off sales of records since 2001, we are left with 77,000 copies sold for Minogue‘s albums up to 2000 included. It fully confirms our range of 30,000-50,000 units for her debut LP which is far and away her biggest for this period in Brazil as suggested by the Top 20 songs ranking.
What about her sales in Asia?
Fever certifications have been documented there and suggest it sold 250,000 to 300,000 units there outside of Japan. The main market for this album was Indonesia with an estimated 50,000 units. During the 90s to early 00s, Indonesia used to be a massive market so we wonder how much she may have sold there, again with a wide margin of error. Singles from Fever represent as much as 54% of her YouTube views though, more than in the US. They are charted at 1-2-3-4 among her personal Top 20 with at least twice more views than anything else. Ultimately, we understand that although Fever sold 50,000 units there, her discography should be barely over 100,000 in total, including the 2001 LP.
Same situation with Mexico.
Fever arguably sold 200,000 units there which could led many people to assume the pop star moved tons of albums in this market. Nevertheless, its singles add for a massive 56,5% of Minogue‘s YouTube views. Her #20 single registers a mere 0,36% of her streams, proving an awful consistency along her career. That’s in line with the fact her albums since 2003 have been charting very poorly in this market.
Below is a summary of calculations to see what’s extracted from YouTube Insights data:
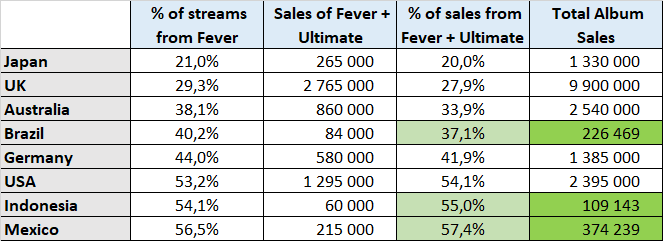
Green cells are calculations. Averages of the closest markets were used to identify the share of sales from Fever plus Ultimate. Obviously, this method doesn’t mean Minogue sold exactly 226,469 albums in Brazil, but it happens to be the closest we can get from official data available and related advanced statistics. Even if we allow for large margin of errors, say assuming 32-42% share of sales for Brazil, the ballpark of 200,000 to 260,000 would be pretty satisfying, reducing a lot the possible error on her early LPs.
On top of that, when we apply the same method to Mexico, Argentina, Indonesia, Taiwan, etc., we reduce the margin of error more and more. Indeed, in some markets her sales will be a bit higher than suggested by her YouTube views, in some a bit lower. Once we apply this process to dozens of countries though there is no reason to expect them all to be either too high or too low.
Conclusions

YouTube Insights clears thousands of question marks
5,664,000 YouTube views are worth a dreadful 482 equivalent album sales as per our CSPC methodology. While this data seems irrelevant, it completely clears a 15-million albums dispute about Meat Loaf‘s Bat Out Of Hell for which claims range from 28 to 43 million. That’s how precious YouTube Insights statistics are.
Obviously, we won’t get official album sales from this tool. Who cares though? As often pointed out, official isn’t the be-all and end-all of charts and sales. Most sales figures aren’t covered by official data at all. Even when they are most of them are largely misunderstood anyway. It’s shown with that 43 million figure related to the Bat Out Of Hell franchise but erroneously repeated by many as a number concerning the 1977 album only.
While they aren’t official, YouTube Insights statistics don’t lie because they reflect an organic popularity. When exploited correctly, with valid scales and points of reference, we can get almost everything from it. That is a real revolution, at last we can put statistics in every cell, there is no more blank area. We can tell which artists did well in which countries and with which albums. It is even better since results aren’t binary yes/no answers. Instead, they enable to have a truly precise view of the popularity of an artist in all markets with all his records.
How to go even deeper
In this article, I tried to simplify the case as much as possible to highlight how precious YouTube Insights is. We can go deeper and deeper still. For example, on top of album sales, catalog downloads of songs can be gauged thanks to their data too.
While using Michael Jackson to value Meat Loaf is fine, we can also extend scales. Combining per market data from YouTube Insights of 50 to 100 major artists would build an even more solid point of reference. With that, we would be able to tell precisely on which markets an artist over or under performed an average of all popular singers. Similarly, Fever is perfect to value remaining Minogue‘s albums but the method is even better with artists who have more than one successful era that is properly document sales-wise.
Whistleblowing at myself
Obviously, YouTube Insights is still relatively new compared to the music industry. I started myself to dig into charts and sales more than a decade before its arrival. It also requires time and experience to understand what we can extract from it as detailed here. That is, checking various statistics from many countries artist after artist, confronting these views with album sales to find out how it is all linked together. While I can now fully use the incredible strength of YouTube Insights while working on CSPC articles, it wasn’t the case until recently. Plus, even once you master all these methods, it takes an awful lot of time to check every detailed data from all markets through various time periods.
That’s why I took the time to share this experience, in order to enable everyone to challenge our information with this method. Now that the process is provided you are welcome to start from these conclusions and contradict something from our site that doesn’t match available statistics. You may want to collect YouTube Insights’ data in the same way it has been done for Meat Loaf and Kylie Minogue here to suggest fixes on sales allowed to markets that tend to be off the radar for many more artists. After all, as Lorde says, we’re on each other’s team.