CSPC: sales & formulas fixing log – Updated audio streaming numbers

Being relevant is tough, remaining relevant is even tougher. It requires you to put into question your own work and your own input.
Unofficial websites like Mediatraffic, as well as official ones including the British Official Charts Company, have been slowly but surely losing relevancy due to their struggle in admitting their past mistakes. At Chartmasters.org, our inflexible objective of highlighting accuracy results into this article that will be fixing every past figure as soon as new information proving a flaw is available.
How will we do that? For which case? Where can you find all the new fixing updates? Well, all those questions are going to be answered in this short article which will ultimately be the home for all updates.
I) The problem

A) Wrong estimates / Erroneous data
Sgt Pepper’s Lonely Hearts Club Band by the Beatles sold more than 5 million units in the UK. It all started with the 4,811,996 sales claim made by the OCC on their all-time Top 100 published in November 2006. From the very first day, various chart followers including myself seriously questioned this figure. It has been agreed for a long time that it is a wrong one, inflated by a good 2 million. Yet, in an attempt to maintain their credibility, the OCC has been continuing to go by that figure, strongly refusing to question the said claim and instead adding new sales to that flawed total. It is just one example among many others.
After a decade of claims without a single fix, their all-time lists ended up being hugely corrupted. With the BPI automatically certifying records on the back of OCC figures, the historical source for fixing erroneous figures is now corrupted as well.
We all make mistakes, myself included. It isn’t that much of an issue – continuing to state an error as a fact is though. That’s why we aren’t going to do that. We will be highlighting and fixing our own errors rather than hiding them.
Things are still getting worst in the OCC side though…
B) Inconsistent methodologies
Although sticking with invalid data is already annoying, the fact that one sale is one sale restricted the impact of that behavior. The arrival of streaming was adopted by chart owners with various formulas. This is all good. Good until you start changing methods in a highly obscure way.
How much has One Dance by Drake sold in the UK ? Answer – we don’t know. We don’t know its download sales nor its streams to date. How come? In the middle of the road, the OCC changed its ratio between streams and downloads from 150:1 to 100:1. Thus, if you add weekly sales of One Dance since its release, you will have a figure that means nothing as the same action is weighted differently from one week to another. If you go by the BPI figure, as they are still using the former 150:1 ratio, the total will be different. Then, if tomorrow the OCC reveals both source indicators – download sales and streams – and apply the current ratio, you will get a third “total to date” value.
The OCC has done nothing to avoid that mess, mixing together figures strongly different in both their nature and their methods to define their all-time best sellers list. By 2020, it will be impossible to determine the meaning of each figure they come out with.
Don’t get me wrong, adjusting formulas is absolutely mandatory in a Streaming World. Chartmasters.org will be doing just that in the next few days once the IFPI Global Music Report of 2017 comes out. The key is to apply the same methodology for all records from all eras, rather than adding each week new figures based on distinct methods.
II) The solution
A) Transparent fixing policy

In order to maintain accuracy, Chartmasters.org has been already fixing values thanks to newly available information or the welcome help of various of its users in the comments. Looking for clarity and transparency, we will now be logging in this present article each and every update that happens.
Concretely, we will be adding one new page to this article for each fix, this new page will include the old value, the new one, the date of the update and an explanation of the change’s root cause.
Please be aware this fixing log will be used to display fixed errors and not updates with new albums / singles released. Also, easy typo fixes that will happen within 48 hours after an article publication will not be tracked here to avoid flooding it with irrelevant updates.
B) Methodology sustainability

As early as in 2013, before the Billboard and the OCC, I have been publishing figures of streaming in sales equivalent. Thus, I feel fully legitimate to support their inclusion and the relevance of methodologies involving them.
On this aim of relevancy, chart providers of several countries lost the real indicators that matters – the raw ones. The total of a CSPC analysis is barely the result of a calculation. The relevant information is raw data of physical, download and streaming sales. It is absolutely fundamental to always secure this raw data to be free to apply a newly adjusted methodology once the market evolved.
All CSPC articles already display this raw data, the Introduction article will also be adjusted when needed to remain ever-relevant. Updates to this article will be tracked here with one new page for each fix too, just like erroneous figures.
In order to inform users of all fixes, each page addition for both cases will be notified on Twitter. Make sure to follow our account to avoid missing an update on your favorite artist figures! If a fix happens to impact strongly various artists, this article will be put in sticky for a couple of days at the top of the homepage to make it visible.
As you can see, your updates matter so feel free to comment as usual! Time for me to go back working on MC article, in-between, continue to enjoy already published content!
Professionalizing physical singles estimates (29/04/2017)
To explain this first cross-artists fixing campaign I’ll be giving some insights of our work at Chartmasters.org. How do estimate sales figures of all records?
The first step logically consists in estimating main markets. Certifications and charts are already known, the experience on those markets is also big so there is rarely home for doubts or relevant errors. In a second step, formulas are used to extrapolate Worldwide amounts. Then, collecting non standard raw data enables to validate each estimate, the goal is to identify figures communicated here and there to fix holes as much as possible.
Once all main markets estimates are set and formulas are up and running, the World total is available. It is never manually changed, this is just a result of all available information within’ the Excel sheet. The last step is made of challenging final results with official sales figures of the IFPI or labels reports – real ones, not claimed labels figures that aren’t legitimate in reality. When a gap is noticed between a World result and a valid known figure, we do an analysis to identify the root cause – which raw data or formula created the flaw. After identifying which estimate / formula is wrong we fix it. Then we check if this new information implies additional adjustments on other records for the concerned country. This process enables to destroy myths of massive Brazilian or Asian sales for example.
As mentioned we have enough experience and knowledge to avoid relevant errors in known markets. The % of possible error will always be rather small. The real deal is with formulas. With Hernan, we know by mind how the album market evolved in all World areas through the decades.
Physical singles sales is much more of a black box yet. We both expected the Spice Girls to easily cross the 20 million mark in that format. To be transparent, the first file of estimates resulted in 23 million units sold, while the article has them on 18 million. In fact this is the figure EMI communicated in 2000. The issue is that the main markets – US, UK, Germany and France – already had a combined tally of 16,6 million with only very well tracked figures, leaving a very small room for sales elsewhere.
I then went deep digging into various old documents and sources to identify exact singles markets figures, to understand how it was possible for the girls power group sold so few units in other countries. Results were pretty shocking – while various off the radar countries saw their album market explode during the 90s, the exact opposite happened in the Singles format that started disappearing from mid-80s in a lot of countries. It feels like the US collapse in 2000 arrived early since we stopped buying such products only 5 years later in Europe, but tons of countries had got rid of them way before the US.
Below table displays two curves. The first is the number of million singles sold per year in the US, the UK, France, Germany, Japan and the Netherlands combined. The second one is the number of million singles sold per year in every other market. From 1973 to 2000, main markets remained pretty stable between 300-500 million thresholds. Sales elsewhere have been highly volatile yet and also collapsed way earlier. They dropped as low as 21 million in 1995/1996, exactly when the Spice Girls exploded. This is less than the number of singles that were being sold in France alone, where the group sold 2,6 million units. The 18 million mark was then fairly logical.
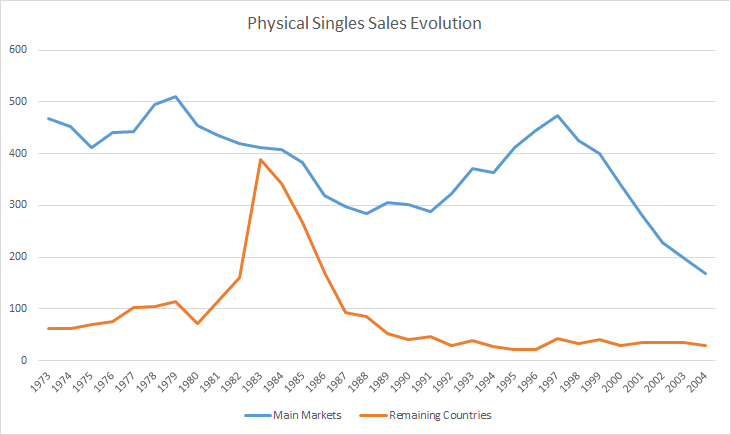
Thanks to this new information, the Excel sheet has been industrialized to extrapolate World sales on the back of main markets estimates not with a fixed ratio, but with an adjusted and precise ratio for each and every year.
The Spice Girls article was published in March 2017, after Whitney Houston and before Mariah Carey, so with old and new methods. This is why formulas gave very different results for the same single in spite of focusing on the same estimates within’ the main markets:
Artist – Mariah Carey & Whitney Houston
Record – When You Believe
Format – Physical Single
Old Value – 1,700,000
New Value – 1,320,000
Update Date – 29/04/2017
As you can guess, what is true for this single is also true for all remaining ones from this period. During the next weeks, I’ll be fully re-vamping physical singles sales with adjusted methods for all artists who sold well in this format during the 90s. Due to the low share of this format in overall CSPC totals – no artist has more than 16% of his total coming from physical singles – it will not conclude on a final adjustment of more than 2/3%. Our target is accuracy yet so we will be fixing everything and keep you updated with all new figures coming out!
Streaming update – inclusion of video streams (01/05/2017)

This is it! Last week the IFPI issued the long awaited Global Music Report 2017. With it comes the overall gross of each music format. Just like last year, the report heavily highlights the Value Gap issue, a naming which refers to the lack of proper monetization of video streams. This is still a $553 million revenue source yet. Used for very long as a marketing tool only, videos are on their way to be profitable by themselves.
To keep ourselves updated with the current market environment, the Commensurate Sales to Popularity Concept will be including Video Streams from today. The immediate question becomes which ratio should we use? For Audio streams, the ratio to convert into album sales is 1500 to 1, as in grossing terms it was equivalent for the industry when this first came into the picture. Taking into account the Value Gap, video streams are way less profitable though. By how much? We will found out right now!
In order to gauge the value of a video stream in comparison to an audio stream, we first need to adjust this latter one with new market information. The IFPI mentions a total of 212 million audio streams users. Last HDD update told us 62% of that market traffic came from Spotify users, which would mean 132 million users. Those figures are perfectly in line with Spotify reports of 100 million overall users by June 2016 and 50 million paid-subscribers in March 2017 up from the 40 million threshold by September 2016. With this 132:212 ratio set up for Audio Streams between Spotify streams and comprehensive streams, we can look at the video side of things to value this market.
The main graphic from the IFPI Report is shown below:

Each audio streamer brings in $18,42 per year on average while each video streamer generates $0,61 only. This is a 30:1 ratio. May I say that the IFPI is cheating us a bit? In order to ring the alarm and get new legislations ready, they naturally presented figures in the most shocking way, this 30:1 gap in value is fake yet.
In fact, the gross of streaming doesn’t depend on the number of users as they are telling us, but instead on the number of streams. Audio streaming platforms subscribers listen on average to way more music than YouTube users since many of those just go on the website checking for a couple of new videos time to time. To illustrate this fact, below is the list of the IFPI Top 10 songs for the year with their streams on both Audio and Video avenues:
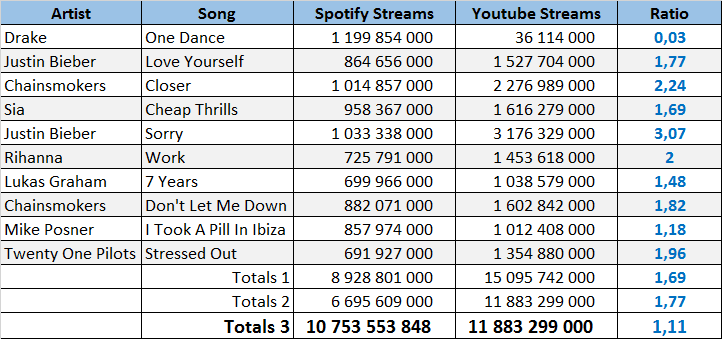
As you can see, there is nowhere near 4,5 more views on YouTube than on Spotify, which isn’t even the entire Audio Streams market. In total (line Totals 1), those 10 songs got 8,9 billion audio streams and 15,1 billion views, a 1,69 to 1 ratio. In every mathematical average based on a sample of data, science tells us to remove outliers. Removing the minimum ratio, Drake song, which wasn’t available for stream on YouTube, and the maximum, Justin Bieber‘s Sorry which broke views records, we get the Totals 2 line, displaying a 1,77 ratio. Of course, we still need to multiply Spotify results by the 132 to 212 weighting in order to get the full Audio Streams totals, this is the content of Totals 3 line.
The conclusion is a 1 to 1,11 ratio between Audio Streams and Video Streams. We do know that during the first half of 2016, audio streams caught and topped video streams in the US. The situation will undoubtedly become true in a World scale too but for now countries like Brazil or Mexico still provide the edge to video streams, although a slight one.
Let’s get back to the gross values. Audio streams generated $3,9 billion dollars. Some 1,11 times more video streams grossed $553 million. In the meantime, audio streams are weighted on 1500 to 1 with album sales, thus, what’s the video streams to album sales ratio? And the answer is…
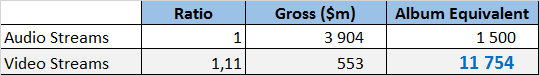
For simplification purpose, I’ll be using for the year a 11,750 to 1 ratio when converting Video streams into Album sales. It means each billion views will conclude on roughly 85,100 album units.
Oh, one last thing, as there is hundreds and hundreds of videos of the same songs on YouTube, we will be tracking only those with over 1 million views. This may seem a high number but it translates only in 85 units, which can be overlooked with no real impact on totals. Obviously, only video clip / live / lyrics videos will be accounted for. Fans covers and the likes will be ignored.
Miley Cyrus CSPC article which is going to be posted very soon will be the first one to be made with this updated methodology, I hope you are going to enjoy it!
Whitney Houston comprehensive update (05/04/2017)
The article of Whitney Houston has been fully adjusted with new methodology for both physical singles and streaming. The former updates are listed below:
Year Song Before After
1984 Hold Me – 350,000 – 360,000
1985 All At Once – 200,000 – 190,000
1985 You Give Good Love – 900,000 – 940,000
1985 Saving All My Love For You – 2,500,000 – 2,600,000
1985 How Will I Know – 1,600,000 – 1,650,000
1986 Greatest Love Of All – 1,400,000 – 1,420,000
1987 I Wanna Dance With Somebody – 3,000,000 – 2,920,000
1987 Didn’t We Almost Have It All – 1,300,000 – 1,290,000
1987 So Emotional – 1,600,000 – 1,500,000
1988 Where Do Broken Hearts Go – 1,100,000 – 1,030,000
1988 Love Will Save The Day – 900,000 – 820,000
1988 I Know Him So Well – 20,000 – 20,000
1990 I’m Your Baby Tonight – 1,900,000 – 1,740,000
1990 All The Man I Need – 1,300,000 – 1,310,000
1991 Miracle – 450,000 – 460,000
1991 My Name Is Not Susan – 350,000 – 310,000
1991 I Belong To You – 40,000 – 20,000
1992 I Will Always Love You – 11,000,000 – 10,560,000
1993 I’m Every Woman – 1,600,000 – 1,440,000
1993 I Have Nothing – 1,200,000 – 1,150,000
1993 Run To You – 300,000 – 290,000
1993 Queen Of The Night – 150,000 – 140,000
1996 I Believe In You And Me – 1,250,000 – 1,110,000
1997 Step By Step – 1,500,000 – 1,280,000
1997 My Heart Is Calling – 100,000 – 80,000
1998 When You Believe – 1,700,000 – 1,320,000
1998 Heartbreak Hotel – 1,750,000 – 1,600,000
1999 It’s Not Right But It’s OK – 1,600,000 – 1,450,000
1999 My Love Is Your Love – 2,900,000 – 2,640,000
2000 I Learned From The Best – 400,000 – 300,000
2000 If I Told You That – 200,000 – 130,000
2002 Whatchulookinat – 150,000 – 130,000
2002 One Of Those Days – 75,000 – 110,000
2003 Try It On My Own – 30,000 – 50,000
2003 One Wish – 20,000 – 25,000
2009 I Look To You – 50,000 – 50,000
2009 Million Dollar Bill – 25,000 – 25,000
1988 One Moment In Time – 1,900,000 – 1,820,000
1989 It Isn’t, It Wasn’t,It Ain’t Never Gonne Be – 225,000 – 180,000
1991 The Star Splanged Banner – 1,100,000 – 1,120,000
1994 Something In Common – 125,000 – 60,000
1995 Exhale – 2,000,000 – 1,750,000
1996 Count On Me – 1,100,000 – 950,000
1996 Why Does It Hurt So Bad – 300,000 – 280,000
2000 Could I Have This Kiss Forever – 900,000 – 740,000
2000 Same Script, Differen Cast – 75,000 – 60,000
Although not exactly a fix but a proper update, sales of both I Will Always Love You download song and The Ultimate Collection album have been increased by 50,000 units each.
George Michael comprehensive update (06/05/2017)

The article of George Michael has been fully adjusted with new methodology for both physical singles and streaming. The former updates are listed below:
Year Song Before After
Bad Boys – 950,000 – 1,010,000
Wham Rap! (Enjoy What You Do) – 600,000 – 350,000
Club Tropicana – 900,000 – 500,000
Young Guns (Go for It!) – 800,000 – 630,000
Club Fantastic Megamix – 300,000 – 220,000
Wake Me Up Before You Go-Go – 3,750,000 – 3,650,000
Everything She Wants – 1,750,000 – 1,520,000
Freedom – 2,400,000 – 2,430,000
Careless Whisper – 6,500,000 – 6,290,000
The Edge of Heaven – 1,500,000 – 1,400,000
I’m Your Man – 1,400,000 – 1,450,000
A Different Corner – 2,200,000 – 2,050,000
Where Did Your Heart Go? – 300,000 – 270,000
Last Christmas – 5,200,000 – 4,980,000
Faith – 2,400,000 – 2,220,000
Father Figure – 1,400,000 – 1,250,000
I Want Your Sex (Parts I & II) – 2,200,000 – 2,010,000
One More Try – 1,800,000 – 1,720,000
Monkey – 1,250,000 – 1,100,000
Kissing a Fool – 900,000 – 760,000
Praying for Time – 1,500,000 – 1,360,000
Freedom! ’90 – 1,150,000 – 1,060,000
Cowboys and Angels – 125,000 – 70,000
Waiting for That Day – 350,000 – 290,000
Mother’s Pride – 200,000 – 180,000
Heal the Pain – 125,000 – 50,000
Jesus to a Child – 1,600,000 – 1,360,000
Fastlove – 1,650,000 – 1,410,000
Older – 225,000 – 180,000
Spinning the Wheel – 500,000 – 410,000
Star People – 325,000 – 270,000
You Have Been Loved – 300,000 – 210,000
Amazing – 200,000 – 150,000
Round Here – 50,000 – 30,000
Shoot the Dog – 100,000 – 50,000
Flawless (Go to the City) – 100,000 – 80,000
Freeek! – 325,000 – 160,000
I Knew You Were Waiting – 1,900,000 – 1,510,000
Don’t Let the Sun Go Down on Me – 2,500,000 – 2,240,000
Too Funky – 1,200,000 – 970,000
Killer/Papa Was a Rollin’ Stone – 125,000 – 120,000
If I Told You That – 200,000 – 130,000
Waltz Away Dreaming – 100,000 – 80,000
Outside – 500,000 – 330,000
As – 400,000 – 240,000
Somebody to Love – 450,000 – 380,000
Coldplay comprehensive update (02/06/2017)

The CSPC article related to Coldplay has been fully updated with the new methodologies which includes YouTube integration and streaming to sales ratio. Figures of streaming and sales were also updated to newly available data.
In the mean-time, fixes have been applied as well to both album sales and physical singles sales. The latter category was adjusted as per the methodology presented on Professionalizing Physical Singles Estimates page from this article. The former category was fixed after identifying enough data to value Coldplay‘s albums sales more accurately than with standard formulas.
Information 1 – Viva La Vida Or Death And All His Friends details
On this tweet, the band presented a plaque with all certifications received by their 2008 album after five years of sales. This album was the band most global record, topping charts in most countries and ending as their top seller in regional markets like Japan. Nevertheless, its certifications from Asian countries minus Japan equal to a mere 97,000 units, nowhere near the standard 70% of Japanese sales – 450,000 units – used when there is no information available for this continent. Of course, certifications are limited to threshold, but even using the higher certification criteria, we fall very short of the standard.
Similarly, continental Europe sales are calculated with Germany, France, Italy, Spain, Netherlands, Sweden, Switzerland, Austria and Finland sales combined plus 30%. As Viva La Vida sold 2,49 million units in those markets it suggests 747,000 units calculated for countries like Belgium, Poland, Russia, Turkey, Denmark or Norway among others. All certifications from continental Europe countries shown in the tweet pic add for only 291,000 units though showing a lower success there from the band. Even more negative, 170,000 copies of that tally is achieved by Denmark and Norway, two markets which disappeared with the arrival of streaming during the 10s, which means that sales outside of the listed panel in Europe for the most recent albums are truly low.
Information 2 – A Head Full of Dreams IFPI Figure
Recently, we learned A Head Full of Dreams shipped 1,4 million units during 2016 after shipping 1,9 million during 2015, pushing the total to 3,3 million. As incredible as it seems, markets listed on breakdowns on our site – US, Canada, Brazil, Mexico, Argentina / Japan / Australia, New-Zealand / UK, Germany, France, Italy, Spain, Netherlands, Sweden, Switzerland, Austria, Finland add for 3,2 million units. This lets a mere 100,000 copies plus a few achieved during 2017 available for all other countries, which again suggests way weaker sales proportionally speaking in Asia, Africa, Middle East and Eastern Europe in comparison to the main music markets.
Results
Year Album Before After
2000 Parachutes – 10,400,000 – 10,100,000
2002 A Rush of Blood to the Head – 14,300,000 – 13,700,000
2005 X&Y – 12,500,000 – 11,900,000
2008 Viva la Vida or Death and All His Friends – 10,500,000 – 9,700,000
2011 Mylo Xyloto – 6,800,000 – 6,300,000
2014 Ghost Stories – 3,700,000 – 3,350,000
2015 A Head Full of Dreams – 3,400,000 – 3,450,000
Linkin Park comprehensive update (03/06/2017)

The CSPC article related to Linkin Park has been fully updated with the new methodologies which includes YouTube integration and streaming to sales ratio. Figures of streaming and sales were also updated to newly available data.
Major updates are listed below.
Format-Record – Before – After
Cumulative Physical Singles Sales – 4,000,000 – 3,210,000
Album Sales Hybrid Theory – 20,000,000 – 20,800,000
Album Sales Meteora – 13,100,000 – 13,300,000
Album Sales Minutes To Midnight – 7,900,000 – 7,800,000
Album Sales A Thousand Suns – 2,800,000 – 2,700,000
Album Sales Living Things – 2,400,000 – 2,250,000
Album Sales The Hunting Party – 1,250,000 – 1,100,000
Final CSPC Total – 74,119,000 – 74,470,000
Digital Singles Sales – Change of weighting (30/06/2017)

As a reminder, the weighting is done with a 10 to 1 ratio between one album and one digital single.
For one year now, you have been used to read this sentence on all CSPC articles. Using this 1:10 ratio was a no-brainer, replicated from Soundscan reports which used it on their Overall Album Sales category, with the specification “INCLUDES ALL ALBUMS & TRACK EQUIVALENT ALBUMS“.
Should it really be a no-brainer though? In fact, it shouldn’t. As in every area of expertise, there is two point of views, the technical side and the functional side. Let’s try to check if that 1:10 ratio is relevant in both of them.
Technical View – Industry-axed, gross-oriented view
The standard price of downloads was for long $9,99 for albums and $0,99 for singles, which explains the logical calculation of Soundscan. This price evolved threw the years with songs set at $0,59 or $1,29 at times. In addition, the ringtone was notably higher priced with standards often on $2,49. As we do include this format, it changes the price average. Obviously, all those prices refer to the US which is used as a scale. It is the biggest digital market overall, by far the biggest for all international artists studied but also it perfectly represents similar prices in place elsewhere.
Below table lists entire data of download singles and ringtones both on price and units as per Soundscan from 2004 to 2016:
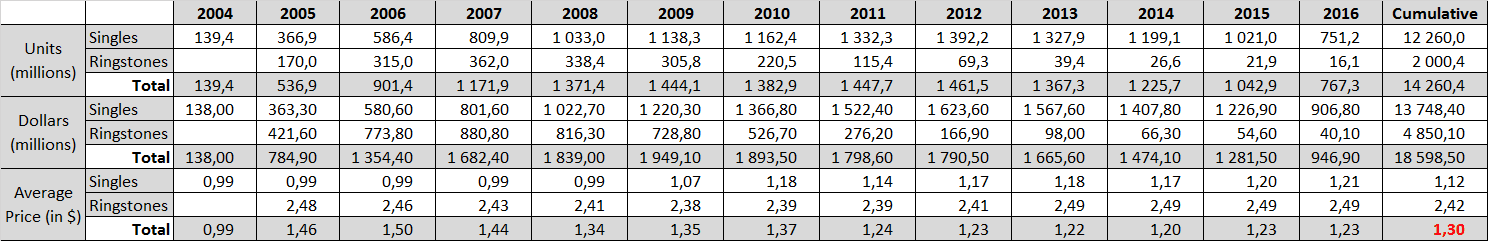
Figures of note are that 14,26 billion units have been sold on those years for a total gross of $18,6 billion. This concludes on the red figure, an average price of $1,30 per unit. It means the technical equivalence between digital singles sales and albums should be 1,3:10 instead of 1:10.
Functional View – Usage-axed, album replacement view
The whole principle of the Commensurate Sales to Popularity Concept is to merge together all figures of an artist to accurately gauge his popularity. While working on that subject, we met countless of times the cannibalization issue, e.g. how the release of some products impacted negatively sales of others.
While many factors impact the market, the cherry-picking capability of downloads appeared to be commercially unviable. The most downloads increased, the most the combined market collapsed. It is perfectly summarized by below table coming from the RIAA:
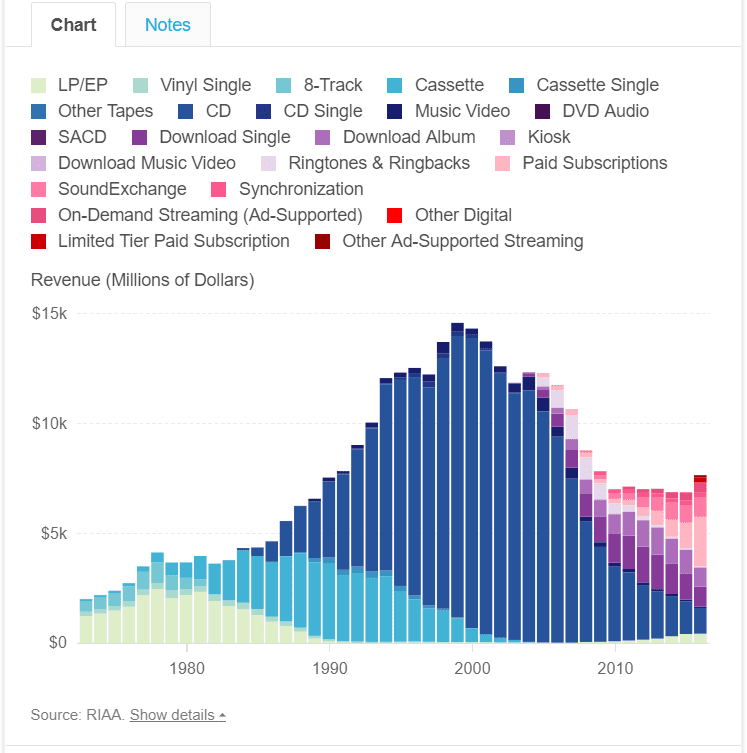
When downloads started to pick up in mid-00s, the market had been stable in the $12-14 billion region for 10 years. As the purple sections, representing downloads, started to grow, CD sales considerably dropped, faster than aforementioned increase of downloads. This conclusion is natural – when you can buy all singles of a popular album for $4/5, why would you pay an average of $15 for the same content plus a few fillers? Here comes a concrete example, the one of Green Day‘s American Idiot album, one of the first major seller on digital formats.
American Idiot (2004) – 1,770,000 equivalent albums
American Idiot – 3,600,000
Jesus of Suburbia – 700,000
Holiday – 3,000,000
Boulevard of Broken Dreams – 4,800,000
Wake Me Up When September Ends – 3,800,000
Remaining tracks – 1,800,000
As many as four singles sold 3 million and more, mostly bought by the same users. In fact, unlike CDs, downloads have never been adopted by the entire population. This is why top sellers are so close to each other, since the low price per unit enables the limited amount of users to buy many tracks. Thus, we are looking at 3 million persons who were interested enough to buy 4 singles or more from this album. In all likelihood, those same persons would have bought the album one decade earlier. That’s 3 million album sales lost, plus 3,2 million singles sold after truncating those 3 million users, e.g. 3,3+ million equivalent album sales. With the 1:10 ratio though, those units are converted into only 1,77 million.
This seems to be more theory than reality, so let’s verify if this intuition is verified at the highest scale, e.g. the entire market. Up to 2003, there was no digital singles sold while from 2007 YouTube and then streaming platforms appeared. Both elements imply that 2004 to 2006 are the most relevant years to identify the functional replacement of album sales by digital singles.
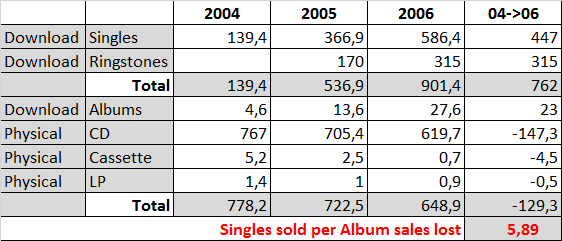
As you can see, every 5,89 digital single sales gained, 1 album sales was lost. It validates the theory of cherry-picking singles shutting down sales of fillers which happened with the album format. This shouldn’t come as a surprise to you if you have been a ChartMasters.org reader for long as we often pointed out how much the general public cares about the hits only. You can also understand here why the average investment in music purchasing per music consumer in 1999 averaged $120 as published by the IFPI while iTunes revealed their average user used to spend on $64. Those latter were downloading 5 singles of one album instead of predecessors having to buy it in full.
Dividing 1 by 5,89 gives us a ratio of 1,7:10, again higher than 1:10.
Conclusion
With a technical ratio of 1,3 to 10 and a functional ratio of 1,7 to 10, it seems natural to update our conversion ratio between digital singles sales to albums sales at 1,5 to 10, replacing the former ratio of 1 to 10.
Application
All articles published after the YouTube views integration will see the digital singles ratio updated as well as their totals within’ the next 72 hours. Older artists who already require an update due to streaming formula update will have their digital sales ratio changed at the same time. New articles will logically be using this new ratio by default from now on.
Audio streaming – Weight of Spotify adjusted (26/04/2018)
The new Global Music Report 2018 of the IFPI is out. As you already know, we have been extrapolating comprehensive Audio Streams (understand, streams from all audio platforms) thanks to the numbers available on Spotify.
As of the report from last year, Spotify had 132 million of the 212 million streaming users in the World. The new document tells us that while Spotify increased its user count to 157 million, there is now 272 million streaming users in total. It highlights in good part the fastest increase of Apple Music lately.
Obviously, we need to adjust our extrapolation formula from now on. Future articles will include the following calculation.
Old Streaming formula: Equivalent Albums Sales (EAS) = 212/132 * Spotify streams / 1500 + YouTube views / 11750
New Streaming formula: Equivalent Albums Sales (EAS) = 272/157* Spotify streams / 1500 + YouTube views / 11750