Rubbish Alert: the Ed Sheeran’s Divide sold “under 11 million” thing

Has Ed Sheeran‘s Divide sold under 11 million units to date or well over 15 million? The latter answer is obviously the correct one, although an immense amount of fake experts online continue to vigorously entertain the ignorance of the general public.
In Sheeran‘s CSPC article we have set Divide‘s total at 15,2 million equivalent album sales as of January 9, 2018. This is 4,5 million ahead of its up to date figure on Mediatraffic. The gap is logically even larger if you check the numbers by the same date, as the album already added 679,000 units since its last update on Chartmasters in audio streams alone, meaning that overall it is well over 16 million by now.
The amateurism and bias of Mediatraffic has been known for very long, but even if it is food for the masses it seems incredible to reach a gap of more than 5 million units between two figures supposed to reflect the same thing, which is global sales plus streaming units of an album. It is of huge importance for me to explain this gap as the fundamental mistake that Mediatraffic has been making since adding streaming figures, and is repeated by almost all online websites and boards.
Some will argue the gap comes from the different weighting of downloads, 1,5:10 on Chartmasters instead of 1:10 as first used by Soundscan, for reasons stated here. In reality, the impact is minor as the estimated 18,55 million digital sales from Divide‘s songs will convert into 1,855 million albums or 2,782 million depending on the formula, a difference of less than 1 million. So, where does this 5+ million gap come from?
Well, many people that lack a real understanding of Charts and Sales complain about our Commensurate Sales to Popularity Concept (CSPC) for one main reason: the formula isn’t official. Let me tell you this is precisely the reason which makes it more accurate than anything you will find online, and also why Sheeran’s analysis doesn’t conclude on a figure as incorrect as less than 11 million.
What’s the official global formula to convert pure sales, tracks downloads, audio and video streams into album sales? …[blank]… Indeed, there isn’t one. The IFPI never communicated a formula, although they do merge all indicators into their Global Recording Artists rankings as we do. The only details listed are:
The independently verified IFPI Global Recording Artist of the Year chart includes sales of albums – across digital, CD and vinyl formats; singles, both downloaded and physical; and on-demand audio streams across the calendar year. The chart includes all the music of each artist featured, not just one track or album. It uses album equivalent units to combine measurements of downloads, physical sales and streams.
It confirms that all formats with the exception video streams are accounted for, but there is no information about weightings. This hole explains how Mediatraffic has been getting things so incredibly wrong.
In fact, this website, as well as most chart freaks, have been estimating global sales by adding individual SPS figures of every market together. It seems natural to add figures from all countries in order to reach a worldwide figure, but it is utter nonsense.
How so? Since there is no official way of measurement from the IFPI national chart bodies all instituted their own local formulas to compile their rankings. Let’s check the case of Audio streams’ conversion. In the US, Soundscan combine 100% of streams of 100% of songs and then divide them by 1,500. In the UK, only the top 12 tracks are considered and the Top 2 are weighted down to the average of the next 10 songs, then the total number of streams is divided by 1,000. In France, the top track is divided by 2 and the cumulative streams are divided by 1,000. In Australia, only the Top 10 tracks are considered, the Top 2 are downgraded to the average of the next 8 and total streams are divided by 1,750.
Lost? Formulas are always hard to digest, so let’s apply them to Sheeran‘s Divide’s cumulative Spotify streams to see how they impact the overall total while using the same set of plays for all methods.
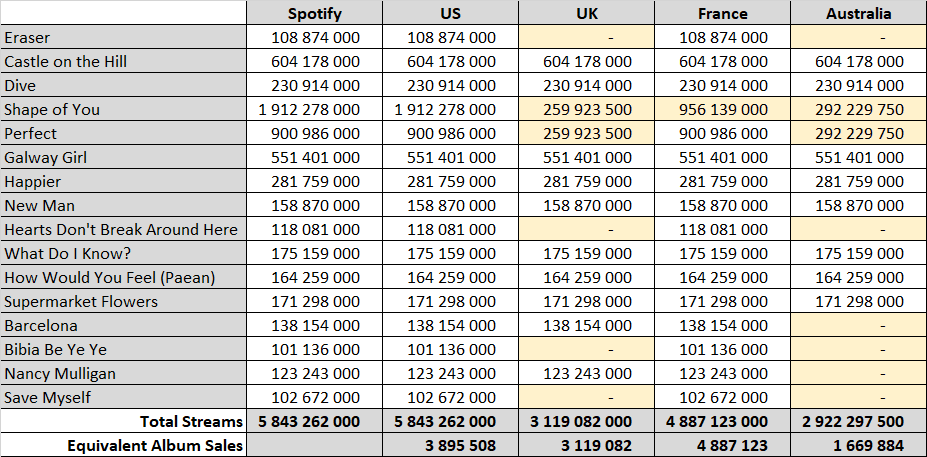
Embarrassing, isn’t it? The same plays which would be translated into 3,9 million album sales in the US result into 4,9 million in France but less than 1,7 million in Australia!
Actually, the truth is even worse. In fact, the 3rd and 4th biggest songs, Castle on the Hill and Galway Girl, were singles at some point. During their promotion they were among the Top 2 tracks on the album instead of Perfect, so their streams have been truncated too with formulas like the ones used in the UK and Australia. For this reason stripping them down to the next 10 too is closer to what the OCC / ARIA are doing. It gives the below results:
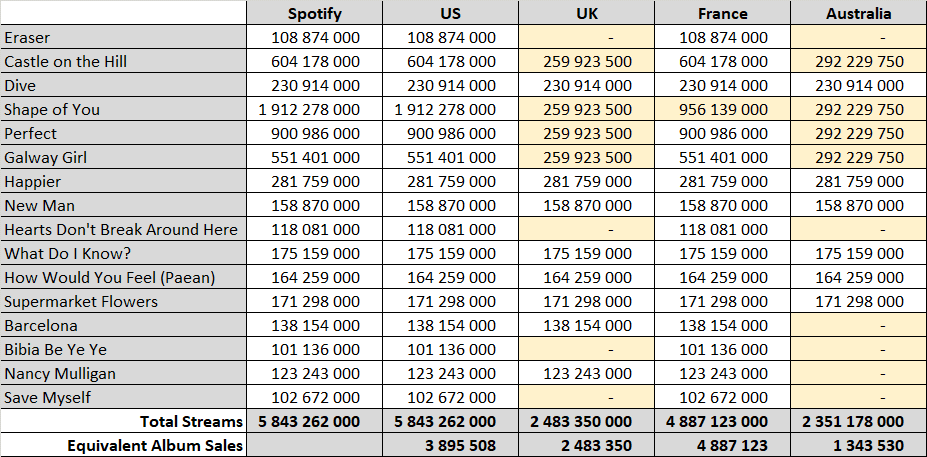
If you play Save Myself in the US or France, your stream will be counted, if you do it in the UK or Australia, it won’t. Your stream of Barcelona is counted in the UK though, but still not in Australia. Then, if you listen to Shape of You in the US, that will count for two times more than in France, 6,5 times more than in Australia and 7,35 times more than in the UK. No matter where you are your stream of Happier will be accounted for in the same way, unless you are using a free subscription in Germany. Listening to the entire album in France will provide it with 3,64 times more chart units than in Australia. And so forth. This results in a mess.
It is key to understand that all methodologies listed here are official under their respective markets. Adding them together means you added only official data. Do you think it is accurate though when they are all inconsistent with one another?
Every country is entitled to build a chart that is relevant to them, and they are free to translate popularity the way they want. They all work with valid raw data and then apply a specific formula, which is fine. Adding results of all their distinct calculations as if they were like-to-like to get Global figures is severely wrong though. It isn’t because a local chart compiler decided that a specific stream isn’t reflective of the popularity they want to highlight on their weekly summary, that this then means the stream is any less real than a chart-eligible one. Indeed, no matter if the OCC, ARIA or the SNEP exclude some streams from their weekly rankings, Sheeran will be paid for them. This is why Global SPS figures can’t be a vulgar sum of locally adjusted data. It gets even worse when some countries include digital downloads or video streams while others don’t.
When Mediatraffic or a chart freak states that Divide sold 10,75 million copies to date, what does it mean then? As you understood by now, it means absolutely nothing. Some downloads were counted, others weren’t. Some streams were counted in full, others partially, others not at all. Most album sales were counted, but some weren’t. Even without caring about the bias and inaccuracies of their estimates, the addition of figures of a completely different nature doesn’t make sense. It isn’t a Sales Plus Streams ranking but instead a Some Sales, Plus Some Downloads, Plus Some Audio Streams and Plus Some Video Streams Minus Some Exclusions ranking, in other words, and to be accurate, we are talking about 10,75 million SSPSDPSASPSVSMSE units. Huh?!
In the case of Divide, the album is over 6 million pure sales and its songs are over 20 million downloads, over 9 billion audio streams and over 11 billion video streams. As previously stated, there is no official formula for worldwide sales, so the only relevant way to work on them is to analyse raw data of all formats and explicitly point out the formula used for merged results as this way everyone is free to adjust them with other methods if they feel it would be better. It is clear that Mediatraffic won’t be fixing all their flaws as they went as far as adding from one day to another SPS units to pure sales in their release to date totals. If you are posting breakdowns on some boards though, or even only some comments, you may want to take a minute, sit back and check if your list of figures is making sense once packaged together. Otherwise, don’t think twice, it’s all right.